I'm attempting a little bit of synergy here. Kickoffs and kick returns have been a topic of conversation in both the comments to last week's College football in 2013 charting post and the Five Factors discussion. Kickoffs make up about one-quarter of the field position equation in college football, which is pretty significant. So let's take a look at what we're dealing with.
Like so much of special teams, kicks and returns have a good deal of randomness involved. To get a good feel for who's good at returning kicks (or preventing good returns), we need a much larger sample than we actually get. One great return can make an inefficient return man look great, while a guy who consistently breaks off 30-yard returns might not rank as high as he should because he never broke one all the way. Brian Fremeau's special teams rankings look at measures of efficiency for each aspect of special teams, so let's take a stab at doing the same thing here.
But first, let's take a look at what we're dealing with.
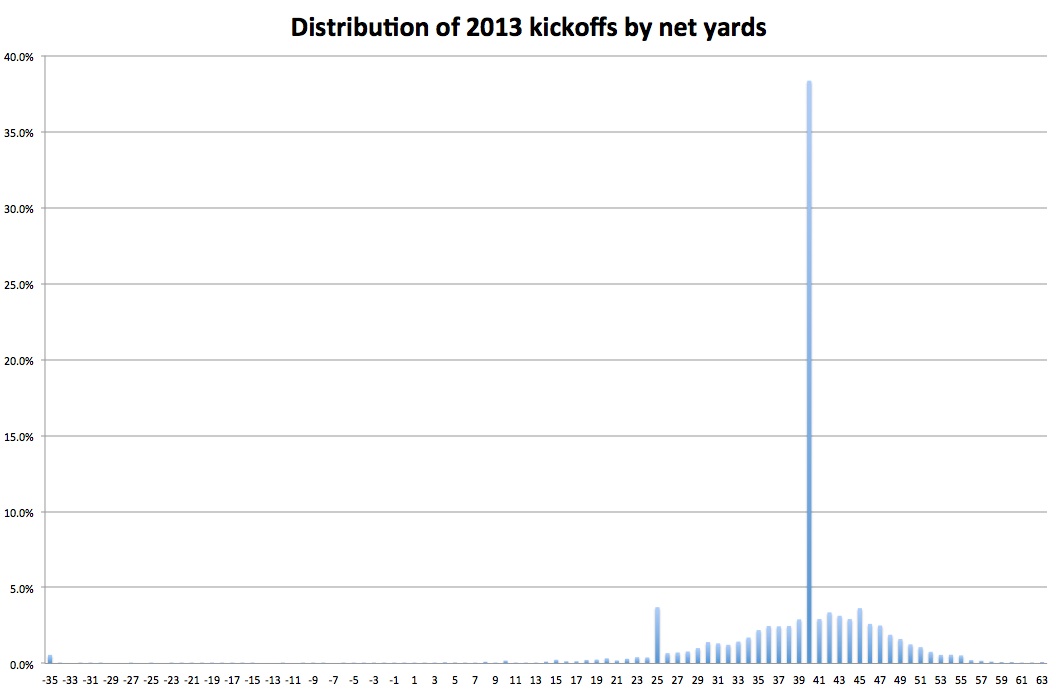
(Net yards are the distance of the kickoff minutes the distance of the return/touchback/out-of-bounds penalty. Onside kick attempts were filtered out of these results.)
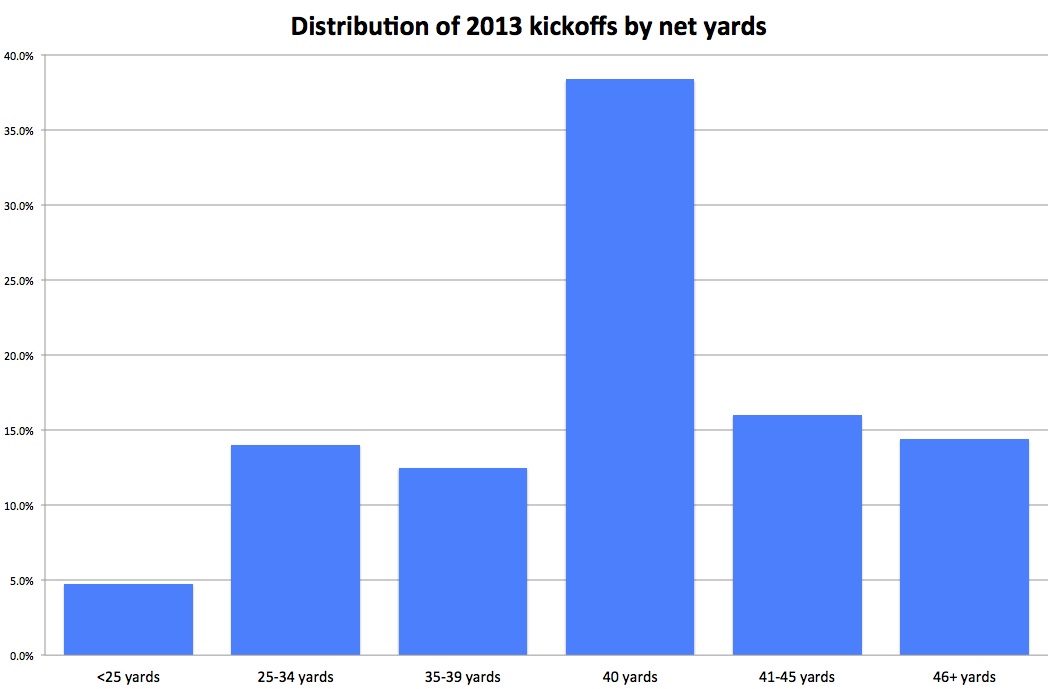
About 35.9 percent of college football kickoffs resulted in a touchback in 2013. Obviously that skews the frequency chart a good amount, but we can also see here that two-thirds of kickoffs resulted in a net of between 35 and 45 yards, or field position between the 20 and 30.
Now, as your average field position creeps toward (or past) your 30, your win percentage pretty quickly begins to skip upward, so this is a pretty significant difference in the grand scheme of things. Still, if you generalize every kickoff you've ever seen, the difference between a return that is stopped at the 21 and the 28 probably blend together. We remember the great and terrible returns and generalize in the middle.
Stats kind of do the same to some degree. Touchback rate is an important measure for gauging kickoff success, but it's not necessarily well-used. If we're judging kickoffs, we're probably doing so with opponent kick returns, which, again, might only look at two of every three kickoffs on average.
So what happens if we create a quick-and-dirty efficiency measure? Since two-thirds of kickoffs net 40 or greater yards for the kicking team, and since 40 is an incredibly common number, what if we created a simple Kickoff Success Rate measure that says any kick with a net of 40 or greater is successful and all others aren't? What does that get us?
| Team | Kickoffs |
Success Rate |
Rk |
Avg. Net of Unsuccessful Kick |
Avg. Net of Successful Kick |
Overall Avg. Net |
Rk |
| Utah State | 86 | 89.5% | 1 | 28.7 | 43.7 | 42.1 | 1 |
| Rice | 79 | 88.6% | 2 | 30.7 | 41.2 | 40.0 | 21 |
| LSU | 86 | 88.4% | 3 | 19.3 | 42.3 | 39.7 | 37 |
| Missouri | 100 | 88.0% | 4 | 26.6 | 41.5 | 39.7 | 35 |
| UCLA | 91 | 87.9% | 5 | 34.4 | 43.0 | 42.0 | 2 |
| Boston College | 74 | 87.8% | 6 | 28.3 | 42.0 | 40.4 | 15 |
| Auburn | 98 | 87.8% | 7 | 22.2 | 41.3 | 38.9 | 60 |
| Tulane | 62 | 87.1% | 8 | 28.8 | 41.6 | 39.9 | 25 |
| Indiana | 77 | 87.0% | 9 | 30.3 | 42.8 | 41.2 | 7 |
| Florida | 51 | 86.3% | 10 | 28.7 | 43.7 | 41.7 | 3 |
| Air Force | 58 | 86.2% | 11 | 31.9 | 41.2 | 39.9 | 24 |
| Texas State | 56 | 85.7% | 12 | 32.6 | 41.3 | 40.1 | 19 |
| Texas A&M | 97 | 85.6% | 13 | 29.9 | 43.1 | 41.2 | 6 |
| Nebraska | 78 | 84.6% | 14 | 29.6 | 41.6 | 39.7 | 33 |
| Tulsa | 55 | 83.6% | 15 | 27.3 | 41.6 | 39.3 | 50 |
| UAB | 62 | 82.3% | 16 | 31.9 | 41.5 | 39.8 | 29 |
| Ole Miss | 78 | 82.1% | 17 | 28.4 | 42.3 | 39.8 | 31 |
| Miami-FL | 83 | 81.9% | 18 | 31.7 | 42.8 | 40.8 | 10 |
| Stanford | 88 | 81.8% | 19 | 33.8 | 43.4 | 41.6 | 4 |
| Virginia Tech | 60 | 81.7% | 20 | 23.8 | 43.3 | 39.7 | 34 |
| Vanderbilt | 74 | 81.1% | 21 | 28.0 | 42.2 | 39.5 | 46 |
| Washington State | 79 | 81.0% | 22 | 27.8 | 44.0 | 40.9 | 8 |
| Illinois | 66 | 80.3% | 23 | 28.0 | 41.6 | 38.9 | 61 |
| Marshall | 101 | 80.2% | 24 | 31.9 | 42.0 | 40.0 | 23 |
| BYU | 80 | 80.0% | 25 | 20.1 | 42.7 | 38.2 | 82 |
| UL-Monroe | 53 | 79.2% | 26 | 27.6 | 42.3 | 39.3 | 52 |
| Arkansas | 51 | 78.4% | 27 | 29.5 | 41.6 | 39.0 | 57 |
| Central Florida | 86 | 77.9% | 28 | 29.3 | 43.6 | 40.4 | 14 |
| Arkansas State | 76 | 77.6% | 29 | 32.5 | 43.2 | 40.8 | 9 |
| Arizona State | 106 | 77.4% | 30 | 24.9 | 43.1 | 39.0 | 58 |
| Clemson | 95 | 76.8% | 31 | 29.2 | 43.1 | 39.8 | 28 |
| Alabama | 90 | 76.7% | 32 | 30.2 | 43.9 | 40.7 | 11 |
| Houston | 84 | 76.2% | 33 | 29.4 | 42.7 | 39.6 | 44 |
| Cincinnati | 75 | 76.0% | 34 | 29.1 | 43.8 | 40.2 | 18 |
| USC | 79 | 75.9% | 35 | 29.2 | 44.0 | 40.5 | 13 |
| Mississippi State | 70 | 75.7% | 36 | 27.6 | 43.0 | 39.3 | 51 |
| Boise State | 90 | 75.6% | 37 | 30.6 | 42.7 | 39.7 | 32 |
| TCU | 61 | 75.4% | 38 | 23.8 | 42.0 | 37.5 | 89 |
| Florida State | 128 | 75.0% | 39 | 29.9 | 43.4 | 40.0 | 22 |
| Toledo | 76 | 75.0% | 39 | 31.5 | 42.3 | 39.6 | 40 |
| UL-Lafayette | 77 | 74.0% | 41 | 23.7 | 43.7 | 38.5 | 72 |
| UTEP | 53 | 73.6% | 42 | 29.4 | 42.5 | 39.1 | 56 |
| North Texas | 79 | 73.4% | 43 | 33.1 | 41.9 | 39.6 | 41 |
| San Jose State | 75 | 73.3% | 44 | 27.4 | 42.4 | 38.4 | 74 |
| Iowa State | 55 | 72.7% | 45 | 29.3 | 43.3 | 39.5 | 47 |
| Rutgers | 66 | 72.7% | 45 | 33.3 | 44.4 | 41.4 | 5 |
| Oklahoma | 84 | 72.6% | 47 | 30.1 | 41.7 | 38.5 | 71 |
| Maryland | 69 | 72.5% | 48 | 29.8 | 44.5 | 40.5 | 12 |
| Georgia Tech | 83 | 72.3% | 49 | 30.0 | 42.7 | 39.2 | 54 |
| Ohio State | 107 | 72.0% | 50 | 31.1 | 43.6 | 40.1 | 20 |
| Nevada | 67 | 71.6% | 51 | 32.1 | 42.2 | 39.3 | 49 |
| Duke | 81 | 71.6% | 52 | 31.7 | 43.1 | 39.9 | 27 |
| North Carolina | 81 | 71.6% | 52 | 29.4 | 42.5 | 38.8 | 64 |
| Texas Tech | 88 | 71.6% | 54 | 28.6 | 42.8 | 38.7 | 65 |
| Arizona | 83 | 71.1% | 55 | 30.1 | 43.0 | 39.3 | 53 |
| San Diego State | 69 | 71.0% | 56 | 27.8 | 42.5 | 38.2 | 80 |
| Oklahoma State | 92 | 70.7% | 57 | 29.0 | 44.4 | 39.9 | 26 |
| Memphis | 51 | 70.6% | 58 | 27.7 | 42.8 | 38.4 | 76 |
| Florida Atlantic | 64 | 70.3% | 59 | 23.9 | 43.4 | 37.7 | 88 |
| Michigan State | 83 | 69.9% | 60 | 32.6 | 42.7 | 39.7 | 38 |
| Iowa | 69 | 69.6% | 61 | 28.8 | 41.6 | 37.7 | 87 |
| Wisconsin | 85 | 69.4% | 62 | 33.5 | 43.4 | 40.4 | 16 |
| Notre Dame | 75 | 69.3% | 63 | 26.3 | 42.0 | 37.2 | 95 |
| Northwestern | 65 | 69.2% | 64 | 33.1 | 42.8 | 39.8 | 30 |
| Minnesota | 68 | 69.1% | 65 | 33.3 | 43.4 | 40.3 | 17 |
| Hawaii | 64 | 68.8% | 66 | 30.9 | 42.2 | 38.7 | 66 |
| South Carolina | 83 | 68.7% | 67 | 28.2 | 41.6 | 37.4 | 92 |
| UTSA | 60 | 68.3% | 68 | 29.6 | 42.6 | 38.5 | 70 |
| Oregon State | 82 | 68.3% | 69 | 30.0 | 43.0 | 38.9 | 62 |
| Georgia | 88 | 68.2% | 70 | 30.1 | 42.6 | 38.6 | 69 |
| Wake Forest | 47 | 68.1% | 71 | 27.9 | 44.7 | 39.3 | 48 |
| Northern Illinois | 102 | 67.6% | 72 | 28.1 | 43.0 | 38.2 | 81 |
| Virginia | 52 | 67.3% | 73 | 29.5 | 43.1 | 38.6 | 68 |
| Central Michigan | 58 | 67.2% | 74 | 31.8 | 43.5 | 39.7 | 39 |
| NC State | 58 | 67.2% | 74 | 25.5 | 41.2 | 36.0 | 116 |
| Michigan | 76 | 67.1% | 76 | 27.6 | 41.3 | 36.8 | 102 |
| Navy | 76 | 67.1% | 76 | 33.8 | 42.6 | 39.7 | 36 |
| Troy | 76 | 67.1% | 76 | 26.7 | 42.2 | 37.1 | 97 |
| Colorado State | 94 | 66.0% | 79 | 28.5 | 41.9 | 37.3 | 93 |
| Kansas | 44 | 65.9% | 80 | 27.1 | 41.6 | 36.7 | 105 |
| Pittsburgh | 67 | 65.7% | 81 | 28.2 | 43.3 | 38.1 | 83 |
| Wyoming | 66 | 65.2% | 82 | 30.7 | 41.0 | 37.4 | 91 |
| Tennessee | 60 | 65.0% | 83 | 26.1 | 42.6 | 36.8 | 101 |
| East Carolina | 93 | 64.5% | 84 | 29.7 | 42.9 | 38.2 | 79 |
| Texas | 76 | 64.5% | 85 | 30.0 | 42.1 | 37.8 | 86 |
| Southern Miss | 47 | 63.8% | 86 | 29.7 | 43.7 | 38.6 | 67 |
| West Virginia | 60 | 63.3% | 87 | 33.1 | 42.5 | 39.1 | 55 |
| Old Dominion | 27 | 63.0% | 88 | 24.0 | 41.2 | 34.9 | 118 |
| Kentucky | 51 | 62.7% | 89 | 30.5 | 44.9 | 39.5 | 45 |
| Colorado | 61 | 62.3% | 90 | 26.0 | 42.3 | 36.2 | 114 |
| Middle Tennessee | 71 | 62.0% | 91 | 24.6 | 43.3 | 36.2 | 115 |
| Baylor | 118 | 61.9% | 92 | 29.4 | 42.0 | 37.2 | 94 |
| New Mexico | 70 | 61.4% | 93 | 32.3 | 42.0 | 38.3 | 77 |
| Penn State | 67 | 61.2% | 94 | 27.3 | 42.3 | 36.5 | 108 |
| Utah | 69 | 60.9% | 95 | 27.3 | 43.2 | 37.0 | 98 |
| Ohio | 74 | 60.8% | 96 | 32.1 | 44.4 | 39.6 | 43 |
| California | 56 | 60.7% | 97 | 28.9 | 42.1 | 36.9 | 100 |
| Bowling Green | 93 | 60.2% | 98 | 33.6 | 42.2 | 38.8 | 63 |
| Western Kentucky | 70 | 60.0% | 99 | 33.1 | 43.9 | 39.6 | 42 |
| SMU | 57 | 59.6% | 100 | 32.2 | 42.0 | 38.1 | 84 |
| Kansas State | 83 | 59.0% | 101 | 31.1 | 43.3 | 38.3 | 78 |
| Temple | 56 | 58.9% | 102 | 25.3 | 44.3 | 36.5 | 106 |
| Kent State | 53 | 58.5% | 103 | 27.8 | 43.0 | 36.7 | 104 |
| Louisiana Tech | 53 | 58.5% | 103 | 30.4 | 44.0 | 38.4 | 75 |
| Oregon | 101 | 58.4% | 105 | 33.0 | 42.3 | 38.4 | 73 |
| South Florida | 43 | 58.1% | 106 | 29.7 | 42.2 | 36.9 | 99 |
| UNLV | 73 | 56.2% | 107 | 27.7 | 42.8 | 36.2 | 112 |
| Fresno State | 97 | 55.7% | 108 | 23.3 | 43.3 | 34.4 | 120 |
| Syracuse | 62 | 54.8% | 109 | 34.0 | 43.1 | 39.0 | 59 |
| Idaho | 46 | 54.3% | 110 | 23.6 | 41.3 | 33.2 | 122 |
| Washington | 92 | 52.2% | 111 | 29.4 | 42.7 | 36.3 | 109 |
| Buffalo | 71 | 52.1% | 112 | 26.5 | 43.1 | 35.2 | 117 |
| Army | 56 | 51.8% | 113 | 28.9 | 43.0 | 36.2 | 113 |
| Massachusetts | 39 | 51.3% | 114 | 28.7 | 43.4 | 36.2 | 111 |
| Miami-OH | 30 | 50.0% | 115 | 31.4 | 43.5 | 37.4 | 90 |
| Ball State | 95 | 49.5% | 116 | 29.9 | 44.5 | 37.1 | 96 |
| Georgia State | 44 | 47.7% | 117 | 24.5 | 42.6 | 33.2 | 123 |
| Purdue | 38 | 47.4% | 118 | 28.2 | 42.2 | 34.8 | 119 |
| Louisville | 90 | 46.7% | 119 | 31.2 | 43.1 | 36.7 | 103 |
| South Alabama | 73 | 45.2% | 120 | 33.0 | 44.2 | 38.0 | 85 |
| Connecticut | 54 | 44.4% | 121 | 32.1 | 41.9 | 36.5 | 107 |
| Akron | 53 | 43.4% | 122 | 31.7 | 42.3 | 36.3 | 110 |
| New Mexico State | 52 | 38.5% | 123 | 24.0 | 40.9 | 30.5 | 126 |
| Florida International | 35 | 37.1% | 124 | 23.6 | 44.2 | 31.3 | 124 |
| Western Michigan | 48 | 35.4% | 125 | 27.4 | 44.5 | 33.5 | 121 |
| Eastern Michigan | 47 | 29.8% | 126 | 25.2 | 43.1 | 30.6 | 125 |
The breakdown here is pretty interesting. We begin to see all-or-nothing teams in the same way we see offenses or defenses. Look at LSU, for instance. The Tigers' average net of 39.7 yards was solid but unspectacular, 37th in the country. But that's because they were going for knockouts. On eight of nine kicks, LSU was netting more than 42 yards per kick; that's an average start of the 23 or so for opponents. On the ninth kick, the Tigers were giving up a pretty large return (or kicking out of bounds) and delivering a net of just 19.3 yards, meaning a start near midfield for opponents. This was basically the special teams equivalent of the Michigan State defense, willing to sacrifice a rare big play for otherwise consistnet dominance. No bend-don't-break here.
The overall net average ranges between 42.1 yards (Utah State) and 30.5 (NMSU), which is significant. But the range of kickoff success rates varies between 89.5 percent (Utah State again) and 29.8 percent (EMU). Combining this with the net average gives us a much more detailed, interesting look at the range of potential outcomes from team to team.
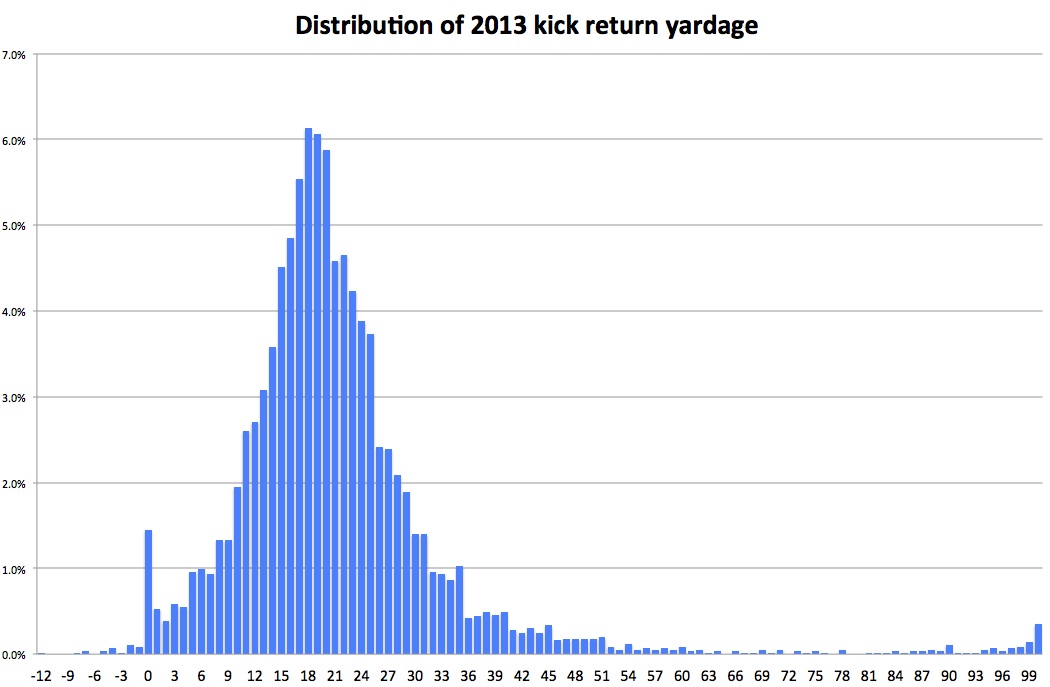
Okay, so what about returns?
And since someone asked in the comments to last week's post...
If a kicking team gives up a return of 24 yards or more, its Kickoff Success Rate drops below 50 percent. This is relatively arbitrary, but let's set the bar there. Let's say that any return 24 yards or greater is a successful return. What does that do for us?
| Team | Returns | KR Success Rate |
Rk |
Avg of Unsuccessful Return |
Avg of Successful Return |
Overall Avg Return |
Rk |
| Florida State | 31 | 48.4% | 1 | 13.9 | 43.4 | 28.2 | 1 |
| UCLA | 46 | 47.8% | 2 | 15.7 | 36.0 | 25.4 | 5 |
| Memphis | 46 | 47.8% | 2 | 15.8 | 32.2 | 23.7 | 25 |
| North Texas | 36 | 47.2% | 4 | 15.8 | 32.8 | 23.8 | 19 |
| Tulsa | 41 | 46.3% | 5 | 16.0 | 30.9 | 22.9 | 38 |
| Miami-FL | 60 | 43.3% | 6 | 17.8 | 34.6 | 25.1 | 8 |
| Missouri | 30 | 43.3% | 6 | 16.5 | 31.6 | 23.1 | 33 |
| BYU | 44 | 43.2% | 8 | 17.2 | 34.6 | 24.7 | 11 |
| Notre Dame | 42 | 42.9% | 9 | 17.4 | 32.3 | 23.8 | 23 |
| Boise State | 47 | 42.6% | 10 | 15.5 | 36.0 | 24.2 | 15 |
| TCU | 38 | 42.1% | 11 | 16.9 | 38.0 | 25.8 | 3 |
| Stanford | 43 | 41.9% | 12 | 15.9 | 43.3 | 27.4 | 2 |
| Central Michigan | 43 | 41.9% | 12 | 16.5 | 32.6 | 23.2 | 31 |
| LSU | 36 | 41.7% | 14 | 17.6 | 36.5 | 25.5 | 4 |
| Baylor | 48 | 41.7% | 14 | 13.9 | 33.4 | 22.0 | 54 |
| Ohio State | 29 | 41.4% | 16 | 16.5 | 32.1 | 22.9 | 37 |
| Florida | 34 | 41.2% | 17 | 16.2 | 37.1 | 24.8 | 9 |
| Kansas | 44 | 40.9% | 18 | 14.8 | 30.2 | 21.1 | 69 |
| Navy | 32 | 40.6% | 19 | 13.4 | 34.2 | 21.9 | 58 |
| Louisiana Tech | 35 | 40.0% | 20 | 16.4 | 30.1 | 21.9 | 57 |
| Oklahoma | 33 | 39.4% | 21 | 15.2 | 35.2 | 23.1 | 34 |
| East Carolina | 28 | 39.3% | 22 | 19.2 | 34.2 | 25.1 | 7 |
| Air Force | 28 | 39.3% | 22 | 19.8 | 29.8 | 23.7 | 24 |
| Maryland | 51 | 39.2% | 24 | 15.5 | 34.3 | 22.8 | 41 |
| UTEP | 46 | 39.1% | 25 | 16.0 | 38.3 | 24.7 | 10 |
| Nebraska | 41 | 39.0% | 26 | 14.9 | 35.1 | 22.8 | 42 |
| Central Florida | 41 | 39.0% | 26 | 16.4 | 32.0 | 22.5 | 45 |
| Marshall | 47 | 38.3% | 28 | 16.8 | 35.2 | 23.9 | 18 |
| Buffalo | 47 | 38.3% | 28 | 14.8 | 33.7 | 22.0 | 52 |
| Kansas State | 37 | 37.8% | 30 | 14.4 | 38.1 | 23.4 | 27 |
| Arkansas State | 40 | 37.5% | 31 | 14.9 | 38.9 | 23.9 | 17 |
| Western Kentucky | 40 | 37.5% | 31 | 14.2 | 27.8 | 19.3 | 100 |
| UNLV | 51 | 37.3% | 33 | 16.3 | 33.9 | 22.9 | 39 |
| Michigan | 51 | 37.3% | 33 | 17.1 | 30.6 | 22.1 | 50 |
| South Alabama | 27 | 37.0% | 35 | 15.3 | 36.1 | 23.0 | 35 |
| Colorado State | 41 | 36.6% | 36 | 17.4 | 34.9 | 23.8 | 20 |
| Northern Illinois | 44 | 36.4% | 37 | 16.0 | 34.9 | 22.9 | 40 |
| San Diego State | 55 | 36.4% | 37 | 15.5 | 30.7 | 21.0 | 71 |
| Houston | 47 | 36.2% | 39 | 16.6 | 40.6 | 25.3 | 6 |
| Bowling Green | 25 | 36.0% | 40 | 16.7 | 37.6 | 24.2 | 14 |
| Florida Atlantic | 25 | 36.0% | 40 | 16.5 | 30.3 | 21.5 | 65 |
| Washington State | 50 | 36.0% | 40 | 15.9 | 29.8 | 20.9 | 75 |
| Washington | 39 | 35.9% | 43 | 13.8 | 40.1 | 23.3 | 30 |
| Louisville | 28 | 35.7% | 44 | 15.3 | 36.1 | 22.7 | 43 |
| Kentucky | 37 | 35.1% | 45 | 16.4 | 30.0 | 21.2 | 67 |
| Georgia Tech | 40 | 35.0% | 46 | 16.3 | 32.6 | 22.0 | 53 |
| North Carolina | 49 | 34.7% | 47 | 15.9 | 38.6 | 23.8 | 21 |
| Oregon | 49 | 34.7% | 47 | 14.6 | 35.1 | 21.7 | 60 |
| Pittsburgh | 49 | 34.7% | 47 | 17.2 | 31.1 | 22.0 | 55 |
| Ohio | 55 | 34.5% | 50 | 14.9 | 29.9 | 20.1 | 87 |
| Rice | 32 | 34.4% | 51 | 13.2 | 31.0 | 19.3 | 101 |
| Ball State | 44 | 34.1% | 52 | 12.7 | 35.9 | 20.6 | 77 |
| South Florida | 47 | 34.0% | 53 | 14.5 | 30.1 | 19.8 | 90 |
| Alabama | 30 | 33.3% | 54 | 16.3 | 41.0 | 24.5 | 12 |
| Duke | 36 | 33.3% | 54 | 16.2 | 40.8 | 24.4 | 13 |
| Iowa | 39 | 33.3% | 54 | 14.5 | 37.0 | 22.0 | 56 |
| Colorado | 48 | 33.3% | 54 | 18.3 | 31.1 | 22.6 | 44 |
| Northwestern | 30 | 33.3% | 54 | 17.7 | 29.8 | 21.7 | 59 |
| Arizona | 33 | 33.3% | 54 | 17.1 | 27.2 | 20.5 | 78 |
| Auburn | 40 | 32.5% | 60 | 15.0 | 40.9 | 23.4 | 28 |
| Rutgers | 47 | 31.9% | 61 | 13.6 | 41.4 | 22.5 | 46 |
| Texas | 41 | 31.7% | 62 | 15.6 | 30.9 | 20.5 | 79 |
| Idaho | 48 | 31.3% | 63 | 16.4 | 30.0 | 20.6 | 76 |
| Clemson | 29 | 31.0% | 64 | 14.7 | 28.0 | 18.8 | 108 |
| Iowa State | 49 | 30.6% | 65 | 13.6 | 41.5 | 22.1 | 49 |
| UTSA | 36 | 30.6% | 66 | 17.9 | 27.9 | 21.0 | 74 |
| Virginia Tech | 33 | 30.3% | 67 | 14.3 | 34.6 | 20.4 | 81 |
| Cincinnati | 33 | 30.3% | 67 | 18.1 | 27.7 | 21.0 | 72 |
| Minnesota | 40 | 30.0% | 69 | 14.5 | 39.8 | 22.1 | 51 |
| Massachusetts | 60 | 30.0% | 69 | 15.3 | 32.4 | 20.5 | 80 |
| Indiana | 50 | 30.0% | 69 | 16.7 | 31.1 | 21.0 | 70 |
| New Mexico | 67 | 29.9% | 72 | 14.8 | 46.2 | 24.2 | 16 |
| Texas A&M | 47 | 29.8% | 73 | 15.8 | 35.1 | 21.5 | 64 |
| Texas Tech | 37 | 29.7% | 74 | 15.5 | 42.8 | 23.6 | 26 |
| Tennessee | 37 | 29.7% | 74 | 18.7 | 35.8 | 23.8 | 22 |
| Arizona State | 45 | 28.9% | 76 | 18.4 | 29.3 | 21.6 | 63 |
| California | 70 | 28.6% | 77 | 16.0 | 30.5 | 20.1 | 86 |
| UAB | 53 | 28.3% | 78 | 14.6 | 35.1 | 20.4 | 82 |
| Texas State | 39 | 28.2% | 79 | 15.5 | 42.2 | 23.0 | 35 |
| Western Michigan | 43 | 27.9% | 80 | 15.4 | 31.9 | 20.0 | 88 |
| Michigan State | 18 | 27.8% | 81 | 15.4 | 29.0 | 19.2 | 103 |
| Georgia State | 58 | 27.6% | 82 | 15.1 | 32.8 | 20.0 | 88 |
| Florida International | 33 | 27.3% | 83 | 16.3 | 33.6 | 21.0 | 73 |
| Utah | 37 | 27.0% | 84 | 15.7 | 26.4 | 18.6 | 114 |
| Wisconsin | 31 | 25.8% | 85 | 16.8 | 41.3 | 23.1 | 32 |
| Oregon State | 66 | 25.8% | 86 | 16.4 | 31.8 | 20.4 | 83 |
| Mississippi State | 28 | 25.0% | 87 | 13.6 | 45.9 | 21.7 | 61 |
| Oklahoma State | 36 | 25.0% | 87 | 17.6 | 40.4 | 23.3 | 29 |
| Utah State | 24 | 25.0% | 87 | 18.7 | 33.8 | 22.5 | 47 |
| NC State | 44 | 25.0% | 87 | 15.5 | 29.5 | 19.0 | 105 |
| Penn State | 36 | 25.0% | 87 | 15.8 | 29.2 | 19.1 | 104 |
| Southern Miss | 57 | 24.6% | 92 | 16.2 | 30.5 | 19.7 | 91 |
| West Virginia | 53 | 24.5% | 93 | 14.4 | 30.2 | 18.3 | 118 |
| Purdue | 49 | 24.5% | 94 | 16.0 | 42.0 | 22.4 | 48 |
| Virginia | 54 | 24.1% | 95 | 15.0 | 29.8 | 18.6 | 115 |
| Georgia | 25 | 24.0% | 96 | 14.3 | 32.2 | 18.6 | 113 |
| Middle Tennessee | 38 | 23.7% | 97 | 17.0 | 36.4 | 21.6 | 62 |
| Fresno State | 55 | 23.6% | 98 | 15.7 | 31.0 | 19.3 | 102 |
| Boston College | 47 | 23.4% | 99 | 13.9 | 40.4 | 20.1 | 85 |
| Tulane | 30 | 23.3% | 100 | 17.0 | 30.6 | 20.2 | 84 |
| UL-Lafayette | 43 | 23.3% | 101 | 13.0 | 40.6 | 19.4 | 96 |
| Arkansas | 35 | 22.9% | 102 | 16.0 | 38.5 | 21.1 | 68 |
| San Jose State | 44 | 22.7% | 103 | 15.8 | 27.7 | 18.5 | 116 |
| Vanderbilt | 45 | 22.2% | 104 | 14.5 | 36.5 | 19.4 | 98 |
| Old Dominion | 28 | 21.4% | 105 | 15.9 | 29.7 | 18.8 | 107 |
| Toledo | 47 | 21.3% | 106 | 13.6 | 37.3 | 18.6 | 112 |
| Temple | 47 | 21.3% | 106 | 15.9 | 32.3 | 19.4 | 97 |
| Illinois | 52 | 21.2% | 108 | 15.6 | 34.0 | 19.5 | 93 |
| Akron | 43 | 20.9% | 109 | 15.1 | 30.4 | 18.3 | 117 |
| Miami-OH | 48 | 20.8% | 110 | 16.4 | 27.2 | 18.6 | 111 |
| Kent State | 53 | 20.8% | 111 | 13.1 | 33.8 | 17.4 | 122 |
| Ole Miss | 34 | 20.6% | 112 | 16.1 | 32.1 | 19.4 | 95 |
| South Carolina | 35 | 20.0% | 113 | 16.3 | 31.7 | 19.4 | 99 |
| SMU | 46 | 19.6% | 114 | 15.3 | 37.9 | 19.7 | 92 |
| Wyoming | 31 | 19.4% | 115 | 14.3 | 27.5 | 16.9 | 123 |
| Hawaii | 52 | 19.2% | 116 | 15.5 | 45.8 | 21.4 | 66 |
| Syracuse | 37 | 18.9% | 117 | 16.6 | 31.9 | 19.5 | 94 |
| Nevada | 37 | 18.9% | 117 | 15.2 | 29.4 | 17.9 | 119 |
| UL-Monroe | 34 | 17.6% | 119 | 14.5 | 39.5 | 18.9 | 106 |
| Eastern Michigan | 68 | 17.6% | 119 | 15.5 | 33.6 | 18.7 | 109 |
| New Mexico State | 47 | 17.0% | 121 | 15.8 | 27.5 | 17.8 | 120 |
| USC | 33 | 15.2% | 122 | 11.7 | 29.8 | 14.4 | 126 |
| Troy | 44 | 13.6% | 123 | 12.9 | 34.8 | 15.9 | 124 |
| Connecticut | 40 | 12.5% | 124 | 17.1 | 30.0 | 18.7 | 110 |
| Wake Forest | 21 | 9.5% | 125 | 15.7 | 33.5 | 17.4 | 121 |
| Army | 40 | 5.0% | 126 | 14.8 | 25.0 | 15.3 | 125 |
I guess Florida State is the LSU in this example. About half of the Seminoles' returns garnered an average of 14 yards or so; the other half averaged more than 43 yards (here's one pretty memorable example). Meanwhile, the range for other pretty good return teams (Notre Dame and Ohio State were each at about 17 and 32 yards, respectively) was much smaller. And as a Missouri fan, I found it difficult to gauge the effectiveness of Marcus Murphy in 2013. He had a kick return touchdown in 2012 (and a couple of punt return TDs) and averaged more than 24 yards per return, but in 2013, he had no scores and an average of only 22.2 yards. This tells us he was still pretty efficient -- more efficient, actually, than Ty Montgomery, who broke off two return touchdowns but got stuffed behind the 25 pretty frequently.
Efficiency is the name of the game in college football, and judging kicks and returns through the lens of efficiency instead of the go-to averages gives us a slightly more accurate look at who was consistently strong outside of the outliers. We'll take a similar look at punts and returns soon.
Loading comments...