/cdn.vox-cdn.com/uploads/chorus_image/image/33082975/Charting6.0.jpg)
Of the approximately 30,000 plays charted by volunteers and Intern Chris...
- 38% started on the left hash, 38% from the right, and 24% from between the hashes.
- 49% took place without a huddle, 51% came with a huddle.
- 56% came from a shotgun formation, 26% with the quarterback under center, and 18% from the pistol.
- 66% took place from a one-back formation, 24% from two-back, 6% from no-back, and 4% from 3-back (or more).
Some other notes:
- On pass plays, the defense rushed four defenders at the passer 61% of the time, five 19% of the time, three 11% of the time, six or more 8% of the time, and one or two just 0.3% of the time.
- On standard downs, 26% of pass attempts were marked as a play-action attempt of some kind. On passing downs, 11% were play-action.
- On plays that started on the left hash, 40% of passes were thrown to the left, 35% were thrown to the right, and 25% were thrown down the middle. Meanwhile, on plays that started on the right hash, 40% of passes were thrown to the right, 36% were thrown to the left, and 25% were thrown down the middle. Because most passers are right-handed, I kind of thought the numbers would favor one side or the other no matter where the ball is lined up. I was incorrect.
- On first downs, 66% of passes were thrown in front of the sticks (i.e. not further than the first-down marker). On second downs, 64%. On third downs, 49%. On fourth downs, 32%. (So yes, my wording in this tweet was incorrect. I went with the wrong cliche. Should have stuck with "on average" or something instead of "more often than not.")
- Sack denominations: 56% in the pocket, 24% a coverage sack, 15% "rusher untouched", 4% "QB fault."
- Of charted scrambles, 40% were deemed to have come because of "overall pressure," 30% were marked "coverage scramble," 20% came because a hole opened up in front of the quarterback, and 2% were undefined.
- Break one tackle, and on average you gained about 8.2 yards after contact. Break two, and you average about 13.6 YAC. Three? 19.8 YAC. Four? 21.6.
Charts!
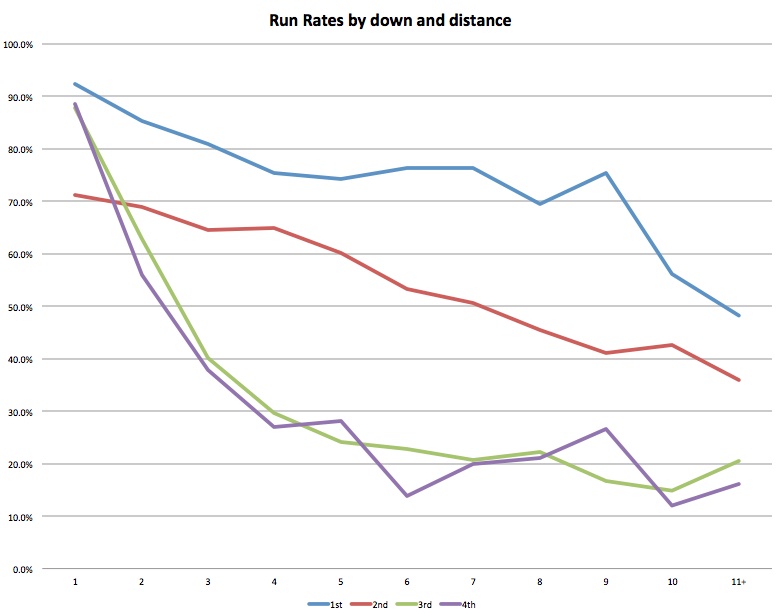
I find it fun that first and second down work in linear fashion -- with run rates falling as the distance to go increases, obviously -- while third and fourth downs almost work as a polynomial function.
Teams run 50% of the time on first-and-11+, on second-and-7, on third-and-3, and on fourth-and-2.
Not as much diversity here as I'd have expected, though because of the small sample of first-and-anything-less-than-10 situations (and the high probability that they're happening near the goal line) make the inclusion of first downs here kind of silly.
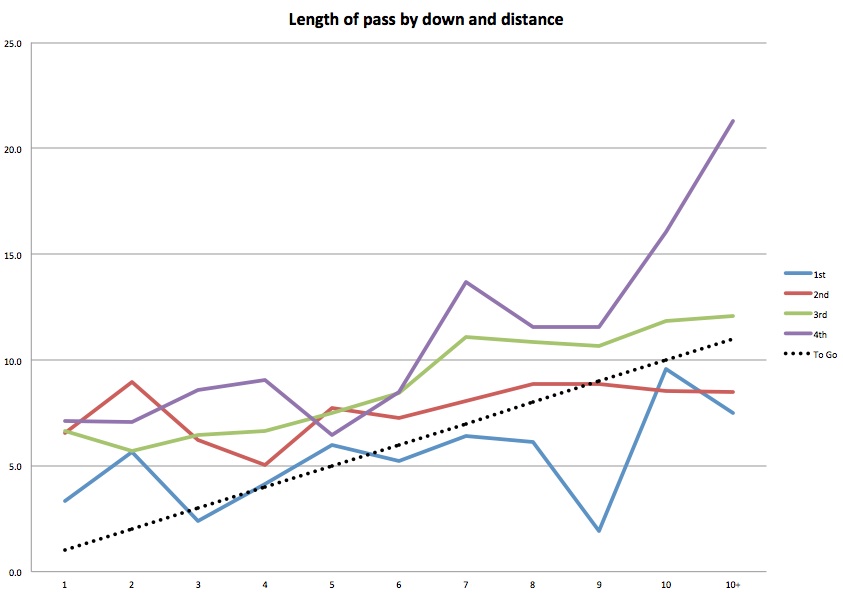
As shared on Twitter. Obviously deep balls skew averages quite a bit here. The average passes here are quite a bit higher than the medians.
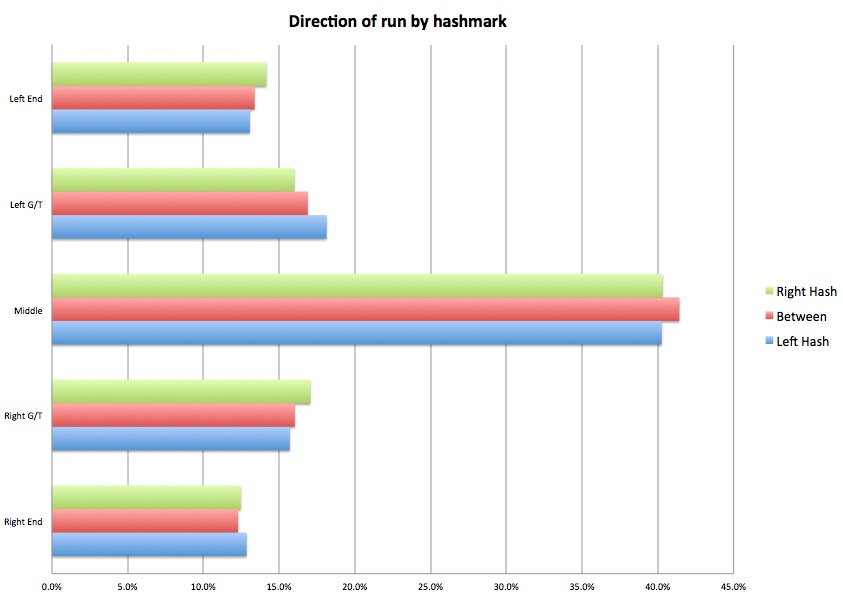
Another unexpected one. I assumed that when teams were lined up on the right hash, they'd run left more frequently than when they're on the left hash (and vice versa). If you look at the rushes off left or right end, you do see that they're slightly more frequent coming from the opposite hash, but only slightly. And if they're looking to run between the tackles, ball placement doesn't seem to matter.
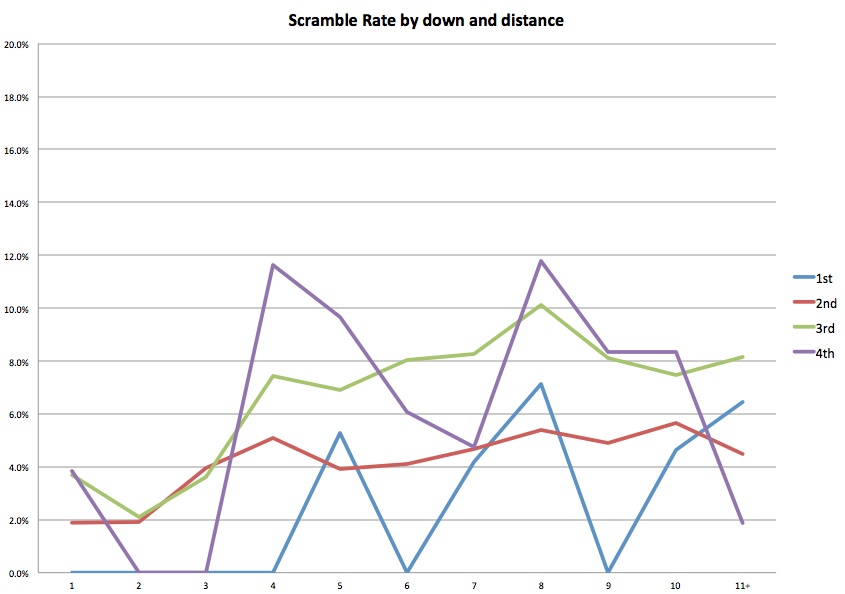
I was curious when and how frequently scrambling happened, so I created a "Scramble Rate" measure. It's basically Scrambles / (Scrambles + Passes + Sacks). Obviously a scramble can lead to a sack, too, but this made the most sense to me based on how these plays were charted.
The verdict: QBs tend to save their scrambling for third and fourth downs, particularly with four or more yards to go. This is what common sense would suggest. First of all, this is when defenses are more likely to blitz. Second, a quarterback is probably going to be more willing to sacrifice his body in a "gotta move the chains on this play" situation.
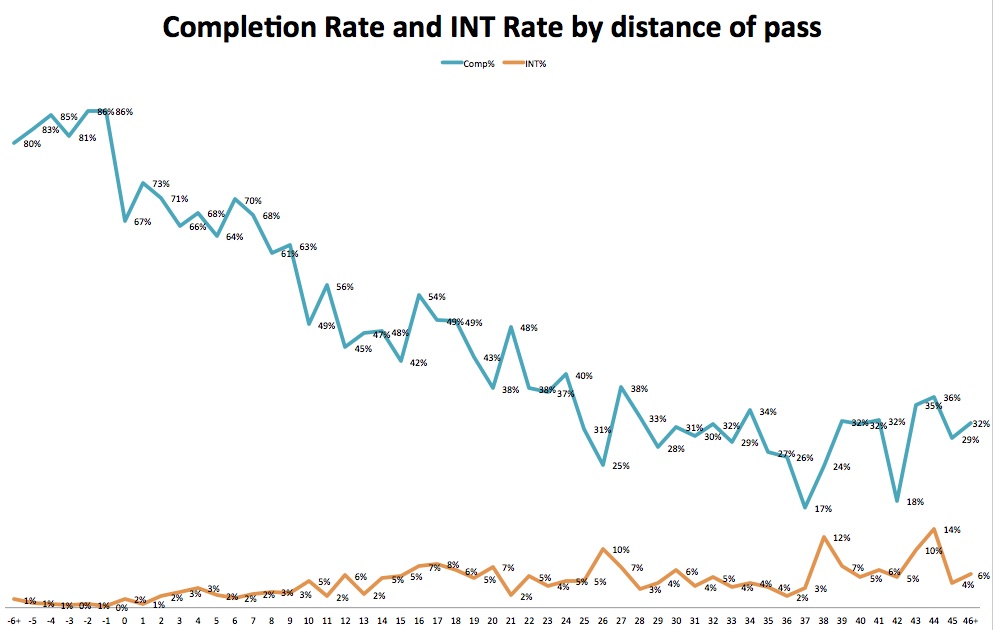
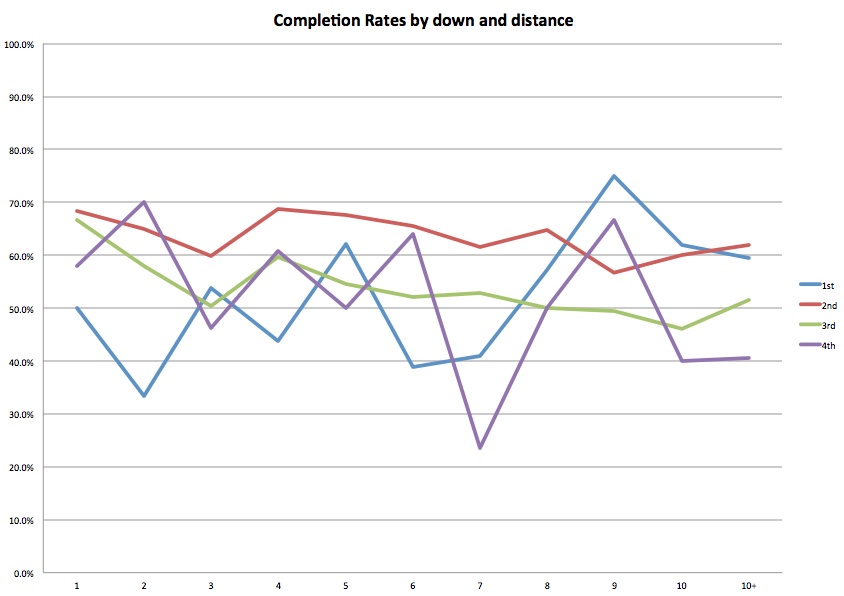
Also shared on Twitter. Passes to a target behind the line of scrimmage are going to be complete more than 80% of the time with minimal interception risk (unless...), and passes thrown one to five yards downfield are going to be in the 70% completion range with about a 2% interception risk. Between about seven and nine yards, completion rates drop pretty dramatically, and interception rates creep up closer to five percent. And on balls thrown more than about 35 yards, it's almost a jump ball.
Loading comments...