The goal with this offseason's Five Factors series has been to take these five keys to winning football games (efficiency, explosiveness, field position, finishing drives, and turnovers) and break them down into independent pieces. There are a few different goals for this. First, I'm jealous of basketball and want to come up with a list of easy-to-track stats the way we see on Ken Pomeroy's site and other corners of the Internet. Second, in order to truly use this Five Factors idea as a jumping-off point for projection, evaluation, coaching purposes, etc. -- in order to be able to take "Team A stunk at field position" or "Team B was awful in the turnover margin" and turn it into something useful or actionable -- we have to dial in as far as we can.
 Five Factors
Five Factors
For the first four factors on the list, I think I've done a decent job of that. But to put the entire picture together, we have to tackle turnovers. And as you might glean from the gap of time between Five Factors posts, it's proven rather difficult. How do you figure out which part of turnovers involves luck and which involves manageable skill and execution? Here's part one of what will probably be many posts on the topic.
In my ongoing season preview series, I make note of turnovers luck pretty frequently, and in the coming Athlon annual, you'll find my references to turnovers and projected turnovers. These refer to two ideas: 1) Fumble recoveries even out toward 50% over time, and 2) the ratio of interceptions to overall passes defensed evens out toward about 21-23% over time. Look at fumbles and passes defensed, compare them to fumble recoveries and interceptions, and voila: you've got yourself a projected turnovers figure.
It's really easy to boil turnovers down to a simple factor of luck. Phil Steele has been doing it for a couple of decades now with his "turnovers = turnaround" lists, and as my little corner of the Internet has grown, I've done the same. And to be sure, turnovers are indeed partially based on luck. They are a significant part of college football games; you have about 56-57 points scored in a given college football game, and on average, a turnover is worth about five points based on field position gained and lost. You can't control where a ball bounces when it falls out of a running backs hands or deflects off of a defender.
However, there is a clear, obvious quality component to turnovers. Fumble recoveries matter, but in theory, you control how many times you fumble. Pass break-ups sometimes turn into interceptions and sometimes fall harmlessly to the ground, but in theory, you at least partially control how many passes are defensed. Luck is a huge part of the equation, but it's not the whole equation.
In this post, we're going to lay some groundwork about interceptions using 2013 charting data. For the 2013 Charting Project, charters were asked to document why an incomplete or intercepted pass was incomplete or intercepted. Combining with the distance of the pass itself, we can break charted passes out like this (click to enlarge):
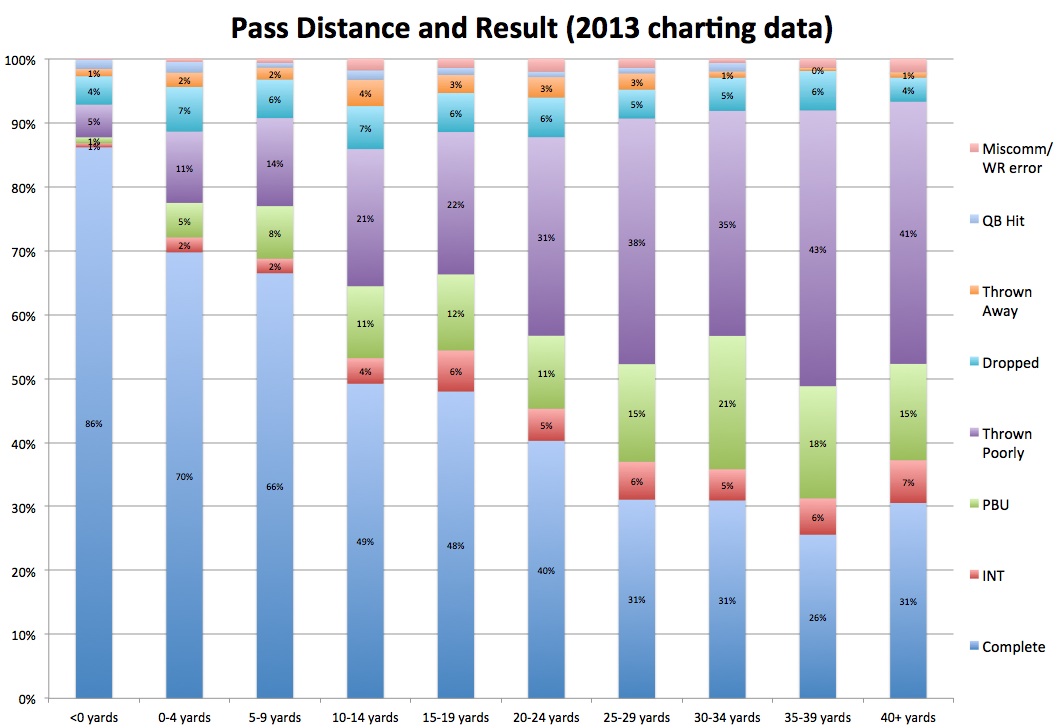
(Quick notes: Passes tipped at the line were tossed out of this sample since we really don't know how far that pass was intended to go. Also: Charters were given the option of selecting categories like "Thrown ahead," "Thrown behind," "Out of bounds," "Overthrown," and "Underthrown"; those four were combined into the "Thrown Poorly" category seen here. Granted, inaccuracy is only one way a pass can be thrown poorly, but that's what we'll use for this post. They'll be broken apart below.)
(Okay, one more note. What constitutes a PBU here doesn't perfectly match what's noted in the box score. Here, it was selected by a charter among a ton of options. In the 'official' data used in season previews and elsewhere, it was selected by the official scorekeeper. Still, this gives you a pretty good idea of what we're working with.)
For all passes in this sample, the results for a given pass are distributed as follows (in descending order): Complete (61.5%), Thrown Poorly (17.0%), INT/PBU (11.2%), Dropped (6.0%), Thrown Away (2.2%), QB Hit (1.2%), Miscommunication/WR error (0.9%). As throws get longer, completion rate drops, and the "Thrown Poorly" and INT/PBU rates increase. That's pretty much what we would expect.
So what about those poorly thrown balls?
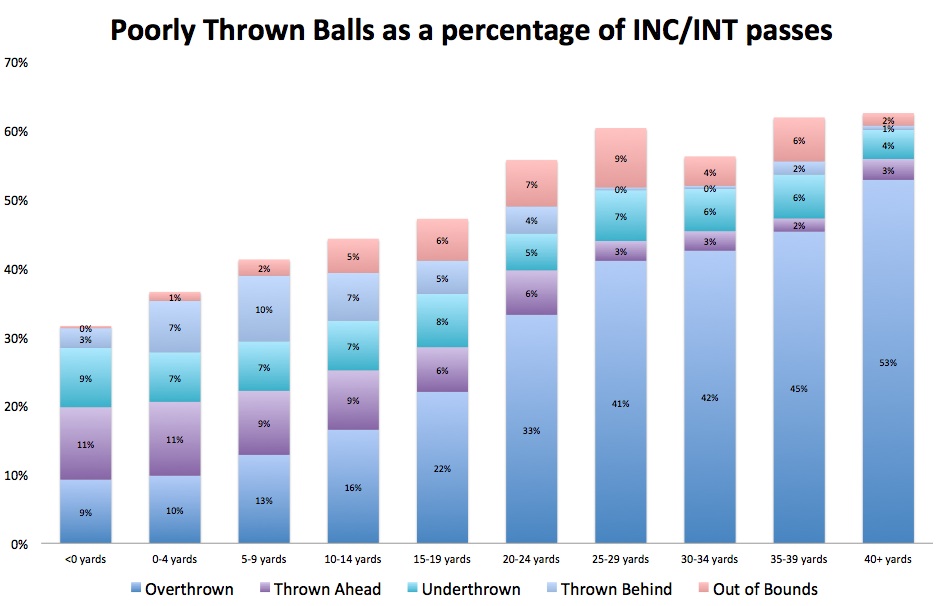
Most "poorly thrown" passes are overthrows, but as we see here, the longer the pass, the more likely it is to be over- or underthrown, and the less likely it is to be thrown ahead/behind. That's basically the nature of the pass itself. Most over- or underthrown passes are going to involve a receiver running vertically and are therefore probably going to be longer balls. Passes thrown ahead or behind the receiver are likely to involve a receiver running horizontally or diagonally at a shorter distance
As it pertains to Five Factors, the relationship between interceptions, passes broken up, and simple incompletions is vital. If we want to figure out the difference between execution and luck, we need to be able to project the expected number of interceptions as accurately as possible.
I found this data particularly interesting for that reason.
| Reason for INC/INT | INC | INT | Total | %INT |
| Overthrown | 870 | 43 | 913 | 5% |
| Defensed | 736 | 165 | 901 | 18% |
| Dropped | 651 | 17 | 668 | 3% |
| Thrown Away | 342 | 1 | 343 | 0% |
| Thrown Ahead | 328 | 9 | 337 | 3% |
| Underthrown | 271 | 33 | 304 | 11% |
| Thrown Behind | 218 | 25 | 243 | 10% |
| Tipped at Line | 190 | 9 | 199 | 5% |
| Out of Bounds | 168 | 0 | 169 | 0% |
| Illegal Contact / Pass Interference | 155 | 4 | 159 | 3% |
| QB Hit | 141 | 15 | 156 | 10% |
| Miscommunication / WR Error | 97 | 18 | 115 | 16% |
| TOTAL | 4,168 | 339 | 4,507 | 8% |
Again, put aside for a moment the idea of the "PBU." Charting data suggests that certain types of incomplete passes are more likely to become interceptions than others, namely "Defensed" passes (which, as used by charters, simply means the defender breaking on an otherwise accurate ball), underthrown passes, passes thrown behind a receiver, passes in which the QB is hit as he throws, and passes that involve miscommunication or receiver error (like falling down). Overthrowing your target or throwing ahead of him is pretty common and relatively safe, but when you underthrow or throw behind him, defenders are more likely to be in the vicinity.
(One other interesting thing to note here: passes that are tipped at the line are very rarely intercepted.)
So are there certain distances at which what we'll "dangerous" throws are more likely to take place?
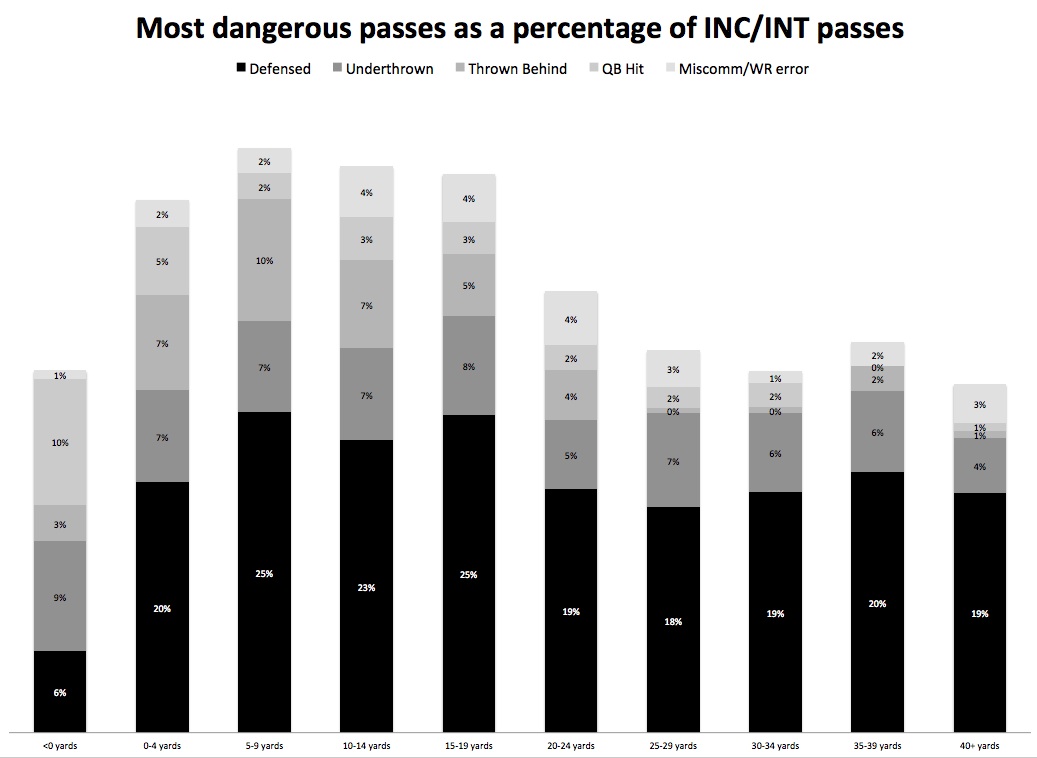
(You like the dark, dreary color scheme here for dangerous passes? I thought so.)
Longer passes are more likely to fall incomplete, but shorter incomplete passes are perhaps more likely to be intercepted, if that makes sense.
More soon ... hopefully.
Loading comments...