We looked at defense last time. This time, we'll switch to offense. My buddy Kyle Porter over at Pistols Firing Blog called this little project looking at the "most misunderstood" offenses and defenses in college football. I think that's a great way of summing up what I'm trying to do in these posts, where we compared traditional stats to advanced stats.
In the defense version, Big 12 teams emerged as the most misunderstood defenses -- traditional stats say they're awful, advanced stats say they're not. How about offenses?
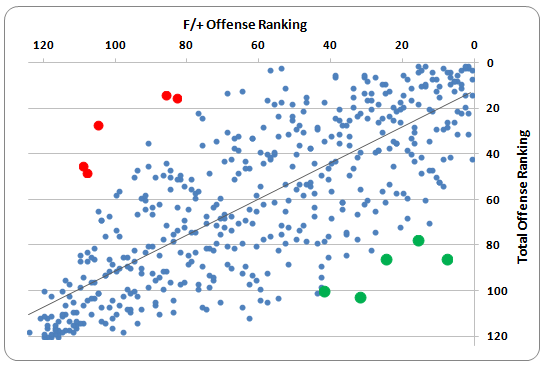
In the chart, I plotted all 480 offense over the past 4 years in college football. A team's F/+ offensive ranking for the season they played in is listed on x-axis. Their total offense ranking (yards/game) for the same season is listed on the y-axis.
As with defense, sometimes traditional stats and advanced stats agree. When comparing the total offense and F/+ rankings for each team, a difference of 10 or fewer spots occurred about 40% of the time. Recent examples of near perfect matches:
- 2012 Oregon: #5 in both total offense and F/+ offense ranking
- 2012 Texas A&M: #3 in total offense and #1 in F/+
- 2012 UCONN: #110 in total offense and #107 in F/+
In the chart, I highlighted ten extremes.
- The 5 dots in green represent teams that are significantly better in F/+ than they are in total offense.
- The 5 dots in red represent teams that are significantly worse in F/+ than they are in total offense.
Four out of the 5 green dots are SEC teams. This is the basically the opposite of what we discovered in the defense post with Big 12 teams. On defense, being on the field for an extra 15 snaps per game makes the traditional stats look bad - really bad in some cases. Even if you're playing good defense, yards given up on those extra snaps add up. Now that we're looking at offense, the slow-down, run-the-ball, huddle-up offenses in the SEC look worse in traditional stats than they do under the F/+ microscope. Here are the top 5 green dots:
| Rk | Team-Year | Total Offense Rk | Off F+ Rk | Difference |
| 1 | LSU-2011 | 86 | 8 | 78 |
| 2 | Florida-2012 | 103 | 32 | 71 |
| 3 | Michigan-2012 | 78 | 16 | 62 |
| 4 | LSU-2010 | 86 | 25 | 61 |
| 5 | Auburn-2011 | 100 | 42 | 58 |
The average offensive plays/game for these five teams is 63.4. The NCAA average from 2009 - 2012 is 69.3. Let's look at the #1 team on the list as an example. In 2011, LSU earned just 355 yards/game, good enough for 86th in the country that season. F/+ identified LSU as the #8 offense in the country in 2011. Here's why:
- Half of F/+ is S&P+, Bill Connelly's system. It analyzes teams using both play-by-play and drive data. S&P+ said LSU had the 8th best rushing offense and the 3rd best passing offense. The S&P+ system ranked the LSU offense #6 overall. More details here.
- The other half of F/+ is FEI, Brian Fremeau's system. It analyzes teams using drive data. FEI wasn't quite as proud of the LSU offense as S&P+ was, ranking the Tiger offense #17 overall. While the component FEI rankings for this offense weren't outstanding in any one category (efficiency, first down rate, etc.), LSU benefited in the FEI rankings from having the 2nd most difficult schedule that any offense faced that year. After adjusting for SOS, the LSU offense was ranked #17 in the FEI system. More details here.
Let's look at the top 5 red teams.
| Rk | Team-Year | Total Offense Rk | Off F+ Rk | Difference |
| 476 | La.-Monroe-2009 | 48 | 108 | -60 |
| 477 | Middle Tenn.-2011 | 45 | 109 | -64 |
| 478 | Houston-2012 | 15 | 83 | -68 |
| 479 | Hawaii-2009 | 14 | 86 | -72 |
| 480 | Middle Tenn.-2009 | 27 | 105 | -78 |
The average offensive plays/game was 73.6 versus the NCAA average of 69.3 -- not a huge difference. Glancing at the teams, my initial guess was that the advanced stats were punishing these teams because they played relatively easy schedules. After looking at Brian Fremeau's offensive SOS rankings for each team, this suspicion was confirmed. The average offensive SOS for these five teams is 109, so even if these teams put up decent offensive numbers, the advanced stat systems didn't take them seriously.
This is just another example of another reason why you should be wary of using traditional stats. There are many things that can skew a simple yards/game measure...SOS is just one of them.
To cap this off, let's look at the top 25 in both the green and red categories.
Top 25 green teams:
| Rk | Team-Year | Total Offense Rk | Off F+ Rk | Difference |
| 1 | LSU-2011 | 86 | 8 | 78 |
| 2 | Florida-2012 | 103 | 32 | 71 |
| 3 | Michigan-2012 | 78 | 16 | 62 |
| 4 | LSU-2010 | 86 | 25 | 61 |
| 5 | Auburn-2011 | 100 | 42 | 58 |
| 6 | Kansas St.-2011 | 101 | 44 | 57 |
| 6 | Miami (FL)-2011 | 70 | 13 | 57 |
| 8 | Vanderbilt-2011 | 98 | 43 | 55 |
| 9 | South Carolina-2012 | 82 | 29 | 53 |
| 10 | Oregon St.-2010 | 94 | 43 | 51 |
| 10 | Pittsburgh-2010 | 72 | 21 | 51 |
| 12 | LSU-2009 | 112 | 63 | 49 |
| 12 | Ohio St.-2009 | 68 | 19 | 49 |
| 14 | Louisville-2011 | 103 | 55 | 48 |
| 14 | Stanford-2012 | 84 | 36 | 48 |
| 16 | Florida-2011 | 105 | 58 | 47 |
| 17 | Clemson-2009 | 74 | 28 | 46 |
| 17 | Florida St.-2010 | 60 | 14 | 46 |
| 17 | Iowa-2009 | 89 | 43 | 46 |
| 20 | Notre Dame-2012 | 54 | 9 | 45 |
| 21 | LSU-2012 | 85 | 41 | 44 |
| 21 | Navy-2009 | 77 | 33 | 44 |
| 21 | Tennessee-2011 | 104 | 60 | 44 |
| 24 | Louisville-2012 | 52 | 10 | 42 |
| 24 | Ohio St.-2011 | 107 | 65 | 42 |
| 24 | Pittsburgh-2009 | 52 | 10 | 42 |
Top 25 red teams:
| Rk | Team-Year | Total Offense Rk | Off F+ Rk | Difference |
| 457 | Central Mich.-2010 | 50 | 89 | -39 |
| 457 | UAB-2010 | 30 | 69 | -39 |
| 459 | North Texas-2009 | 36 | 76 | -40 |
| 459 | Troy-2011 | 65 | 105 | -40 |
| 461 | Fresno St.-2012 | 16 | 58 | -42 |
| 461 | Rice-2012 | 44 | 86 | -42 |
| 461 | Texas-2010 | 58 | 100 | -42 |
| 461 | Troy-2012 | 11 | 53 | -42 |
| 465 | Western Mich.-2009 | 56 | 99 | -43 |
| 466 | UAB-2012 | 50 | 95 | -45 |
| 467 | Akron-2012 | 45 | 91 | -46 |
| 468 | New Mexico St.-2011 | 47 | 94 | -47 |
| 469 | Arkansas St.-2011 | 24 | 76 | -52 |
| 469 | Nevada-2009 | 2 | 54 | -52 |
| 471 | Utah St.-2009 | 12 | 65 | -53 |
| 472 | Troy-2009 | 3 | 57 | -54 |
| 473 | UAB-2009 | 22 | 77 | -55 |
| 474 | Toledo-2009 | 13 | 69 | -56 |
| 474 | Tulsa-2009 | 35 | 91 | -56 |
| 476 | La.-Monroe-2009 | 48 | 108 | -60 |
| 477 | Middle Tenn.-2011 | 45 | 109 | -64 |
| 478 | Houston-2012 | 15 | 83 | -68 |
| 479 | Hawaii-2009 | 14 | 86 | -72 |
| 480 | Middle Tenn.-2009 | 27 | 105 | -78 |
Loading comments...