Despite the media's slow acceptance of advanced stats, you still see plenty of references to traditional stats. Total offense/defense is probably the most commonly used misused stats in football. You can understand why...it's so easy to grasp. Yards / game. That's it.
As readers of this site know, however, it has serious limitations. One team's game does not equal another team's game: last season, Houston's defense averaged 85.9 plays per game. Alabama averaged 59.8, a difference of 26.1 plays. At the same time, allowing 378 yards/game (the NCAA average over the past four seasons) against Pac 12 offenses is vastly different from doing the same against Sun Belt offenses. Still, you won't see any correction for strength of schedule in a traditional total defense list.
I'm not breaking any news here -- you already know all of this. I thought it would be interesting, though, to look at the teams that have the biggest various between traditional stats and advanced stats. In this post, we'll look at total defense versus F/+ defensive rankings.
I'm using the last four years of college football (2009 - 2012).
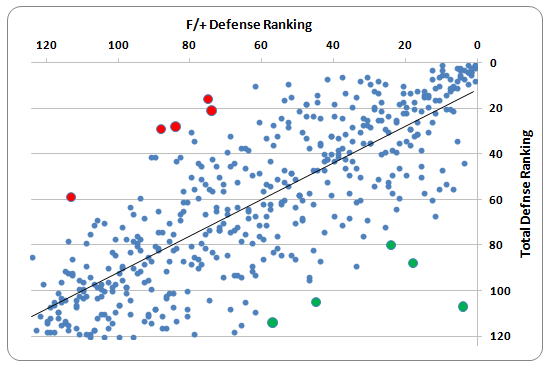
In the chart, I plotted all 480 defenses over the past 4 years in college football. A team's F/+ defensive ranking for the season they played in is listed on x-axis. Their total defense ranking for the same season is listed on the y-axis.
A few notes: traditional stats suit some teams just fine. For example, from 2010-2012 Alabama had the exact same total defense and F/+ ranking (#5, #1, #1). When you dig in a little further, you find out that sometimes traditional stats work just fine for many teams: a variance of 10 or fewer spots between F/+ and total defense occurred 227 times out of 480 (47.3% of the time). But we're not here to talk about the instances where traditional stats work.
In the chart, I highlighted 10 extremes.
- The 5 dots in green represent teams that are significantly better in F/+ than they are in total defense.
- The 5 dots in red represent teams that are significantly worse in F/+ than they are in total defense.
The green dots are all Big 12 teams. It's not hard to understand why...over the last four years, Big 12 offenses have been really good and the conference features lots of teams that use an up-tempo offense. This creates more plays, and thus more yards, for Big 12 defenses. Let's look at the top 5 green teams:
| Rk | Team-Year | Total Defense Rk | Def F/+ Rk | Variance |
| 1 | Oklahoma St.-2011 | 107 | 4 | 103 |
| 2 | Oklahoma St.-2010 | 88 | 18 | 70 |
| 3 | Texas A&M-2009 | 105 | 45 | 60 |
| 4 | Texas Tech-2010 | 114 | 57 | 57 |
| 5 | Oklahoma St.-2012 | 80 | 24 | 56 |
As an Oklahoma State fan, I'm not surprised to see the Cowboys so high on this list. Still, 3 out of the top 5 in the last four seasons is a little extreme. The 2011 defense allowed a ton of garbage time yards, which are included in total defense but not included in F/+. They also generated a crazy number of turnovers (44 turnovers in 13 games) and were countered by an up-tempo, quick-scoring offense that put them back on the field for roughly 84 plays/game that season. The NCAA average for the 2011 season was 69 plays/game.
When Oklahoma State was left out of the BCS title game in favor of Alabama, their weak defense was often brought up as a reason for voters to choose Bama. As someone who watched every Oklahoma State game that season, I would testify that Alabama's defense was unquestionably better than Oklahoma State's. Still, the Cowboys were victimized by traditional stats in a way -- I listened to several national commentators talk about Oklahoma State's terrible defense. By the way, according to F/+ the 2011 Bama defense is the best of any unit from 2005 to 2012. I don't have an issue with Bama playing for the title that season, by the way. Oklahoma State's loss to Iowa State was inexcusable for a national title contender.
Okay, I'm done with my therapy session. One more comment about Oklahoma State. In the last three seasons the Cowboys have had an excellent or decent defense according to F/+ (#18, #4, #24) but a terrible or mediocre defense according to total defense (#88, #107, #80). Defensive coordinator Bill Young oversaw all three of those units, and he was shown the door in the offseason. Another victim of traditional stats?
The other two teams on the green list were in the Big 12: A&M in 2009 and Texas Tech in 2010. Both were considered awful by traditional standards and average by F/+.
Now, let's look at the flip side of this coin. The top 5 red teams: good in total defense, bad in F/+:
| Rk | Team-Year | Total Defense Rk | Def F/+ Rk | Variance |
| 476 | La.-Monroe-2011 | 21 | 74 | -53 |
| 477 | Kentucky-2012 | 59 | 113 | -54 |
| 478 | Miami (OH)-2010 | 28 | 84 | -56 |
| 479 | Temple-2010 | 16 | 75 | -59 |
| 479 | Army-2010 | 29 | 88 | -59 |
There's a tie at the bottom, so let's look at Army. By traditional standards, they had a pretty solid defense - #29 in the country. By F/+, however they are well into the bottom half of defensive units in college football. Let's find out why.
In 2010 Army allowed 338 yards per game, 40 yards better than the NCAA average of 378. However, they allowed 5.8 yards per play, 0.3 yards above the NCAA average of 5.5. The reason: Army's defense was on the field for an average of 58 snaps per game that season, 11 plays fewer than the NCAA average. Their defense benefited from an offense that ran the ball 84% of the time -- the highest percentage of any team in college football that season (the NCAA average was 55% in 2010). That factored in with a relatively weak schedule (Brian Fremeau ranked their defensive SOS at 87 that year) allowed Army to fare well in total defense but weak when you take a closer look.
Let's look at the top 25 in each category...maybe you'll see your team:
Top 25 GREEN (14 out of 25 are Big 12 teams!):
| Rk | Team-Year | Total Defense Rk | Def F/+ Rk | Variance |
| 1 | Oklahoma St.-2011 | 107 | 4 | 103 |
| 2 | Oklahoma St.-2010 | 88 | 18 | 70 |
| 3 | Texas A&M-2009 | 105 | 45 | 60 |
| 4 | Texas Tech-2010 | 114 | 57 | 57 |
| 5 | Oklahoma St.-2012 | 80 | 24 | 56 |
| 6 | Oregon-2011 | 67 | 12 | 55 |
| 6 | Arkansas-2009 | 89 | 34 | 55 |
| 8 | Arizona-2012 | 118 | 68 | 50 |
| 9 | Houston-2012 | 115 | 66 | 49 |
| 10 | Iowa St.-2011 | 95 | 47 | 48 |
| 10 | Oklahoma-2011 | 55 | 7 | 48 |
| 12 | Iowa St.-2012 | 94 | 47 | 47 |
| 12 | Toledo-2012 | 109 | 62 | 47 |
| 12 | Auburn-2010 | 60 | 13 | 47 |
| 15 | Kansas St.-2011 | 72 | 26 | 46 |
| 16 | Texas A&M-2010 | 55 | 11 | 44 |
| 16 | UCLA-2012 | 76 | 32 | 44 |
| 16 | Oklahoma-2010 | 53 | 9 | 44 |
| 19 | Tulsa-2011 | 87 | 44 | 43 |
| 20 | Texas A&M-2012 | 57 | 15 | 42 |
| 21 | Oklahoma-2012 | 64 | 23 | 41 |
| 22 | Baylor-2012 | 119 | 79 | 40 |
| 22 | Oregon-2012 | 44 | 4 | 40 |
| 22 | Arkansas St.-2010 | 105 | 65 | 40 |
| 25 | West Virginia-2012 | 108 | 69 | 39 |
Top 25 RED:
| Rk | Team-Year | Total Defense Rk | Def F/+ Rk | Variance |
| 455 | Buffalo-2011 | 63 | 97 | -34 |
| 455 | La.-Monroe-2009 | 44 | 78 | -34 |
| 455 | Fla. Atlantic-2012 | 70 | 104 | -34 |
| 458 | Akron-2009 | 59 | 94 | -35 |
| 458 | Syracuse-2010 | 7 | 42 | -35 |
| 458 | Western Ky.-2012 | 26 | 61 | -35 |
| 461 | Colorado St.-2009 | 78 | 114 | -36 |
| 461 | Navy-2012 | 71 | 107 | -36 |
| 463 | Colorado St.-2012 | 69 | 106 | -37 |
| 463 | Buffalo-2010 | 32 | 69 | -37 |
| 463 | Wisconsin-2011 | 15 | 52 | -37 |
| 466 | Army-2009 | 16 | 54 | -38 |
| 467 | Army-2012 | 85 | 124 | -39 |
| 468 | Army-2011 | 43 | 84 | -41 |
| 469 | Arkansas St.-2009 | 41 | 83 | -42 |
| 470 | UCF-2011 | 9 | 53 | -44 |
| 471 | Eastern Mich.-2011 | 34 | 79 | -45 |
| 472 | Hawaii-2012 | 41 | 90 | -49 |
| 473 | Ohio-2010 | 41 | 91 | -50 |
| 473 | Northern Ill.-2009 | 30 | 80 | -50 |
| 475 | Kent St.-2010 | 10 | 62 | -52 |
| 476 | La.-Monroe-2011 | 21 | 74 | -53 |
| 478 | Kentucky-2012 | 59 | 113 | -54 |
| 480 | Miami (OH)-2010 | 28 | 84 | -56 |
| 482 | Temple-2010 | 16 | 75 | -59 |
| 482 | Army-2010 | 29 | 88 | -59 |
Loading comments...