-format(webp)/cdn.vox-cdn.com/uploads/chorus_image/image/30968759/452654569.0.jpg)
One of my favorite parts of writing Study Hall was talking to coaches about the art of finishing drives. Everybody agreed that moving the ball near the goal line is different than moving the ball with 80 yards in front of you, but nobody attacked it in the same way.
Okay, so finishing drives matters. How do coaches coach that? The answer varies dramatically.
Take Bob Stitt and Sonny Dykes. In terms of general offensive philosophy, the two are generally considered rather similar. Stitt, the head coach at Division II’s Colorado School of Mines, has crafted a funky, unique, underdog-friendly spread offense, mostly out of necessity. Because of rigorous academic standards, the Orediggers are rather overmatched physically; but in 13 seasons, Stitt has gone 90-57, 69-41 in the RMAC, thanks mostly to an explosive offense that combines the West Coast principles he learned as a graduate assistant at Northern Colorado with spread formations he built through experimentation. His teams throw a lot – 57.5 times per game in 2012 – but they also take major pride in being able to punch the ball into the end zone when they get the chance.
"We practice red zone situations three times per week," Stitt says. While the conventional wisdom is that a pass-first team is going to struggle near the end zone because the field shrinks and defenders don’t have to worry about getting stretched vertically, Stitt thinks the opposite.
"Simply being a run-first team does not mean being a good red zone team," Stitt says. "I was watching Georgia Southern play North Dakota State [in the 2012 Football Championship Subdivision (FCS) semifinals], and Georgia Southern’s percentage of touchdowns was really, really low. And they run the heck out of the ball, they’re fantastic running the ball with the option. But once they get close to the goal line, it’s really tough on them. Defenses don’t have to fear play-action. You have to be a good passing team to score touchdowns in the red zone."
Fisher DeBerry loved running his option because he didn't have to change his play-calling near the goal line. Todd Berry takes shots toward the end zone from the 30 because things bog down closer in. Bob Stitt passes a lot but also brings in DTs at fullback. Everybody has a different philosophy, which makes it a really fun topic.
It's also a very useful topic, obviously. It can decide games.
Football basically boils down to creating opportunities and converting them. You create opportunities based on where you start your drives (field position) and how well you move the ball (efficiency and explosiveness); that's a significant part of the equation. FBS teams created between 3.0 (Miami-OH) and 9.7 (Baylor) scoring opportunities (i.e. trips inside the 40) in 2013. They created scoring opportunities on between 23.5 percent (Miami-OH again) and 67.0 percent (Florida State) of their drives. You can overpower a team by simply creating more opportunities than they can either thwart or create themselves.
Nearly half of the teams in FBS, however, hovered between 44 and 54 percent when it comes to creating scoring opportunities. Eighty-nine hovered between 39 and 59 percent. A good portion of the time, you're going to create roughly the same number of opportunities as your opponent; how you convert those opportunities will probably make the difference in whether you win or lose.
 Must Reads
FBS teams averaged about 4.24 points per scoring opportunity in 2013. The range skews a lot lower (minimum: FIU's 2.36) than high (maximum: Ohio State's 5.58), and the median is 4.28.
The point of these posts is to determine what components go into each of the five factors I've been working with so we can strip them apart and make them as independent of each other as possible. So let's do that now with the topic of the day, finishing drives.
The components
The go-tos: Success Rate and IsoPPP
IsoPPP is a new discovery -- I latched onto it during my second Five Factors post, and I've basically bought the car after a pretty short test drive. It makes me a bit uneasy to do that, but ... well, I really like this measure, and I like the simplicity it adds to the discussion when paired with Success Rate. It basically boils football down to "How often are you successful?" and "When you're successful, how successful are you?"
Regardless, at this time Success Rate is my go-to efficiency measure, and IsoPPP is my go-to explosiveness measure. That could change.
For reasons I've mentioned before, my go-to stat for finishing drives is your average points per trip inside the opponent's 40. The correlation between this average and a team's overall Success Rate is 0.813 on offense and 0.628 on defense. The correlations for Points Per Trip and IsoPPP are 0.451 on offense and 0.529 on defense.
Good red zone offenses tend to also be good offenses. Go figure. But there's a bit more to it than that.
Redzone success rate
If moving the ball near the goal line is indeed a different skill, then teams' success rates in the red zone -- which I've always defined as inside the 25 in my stats, both because it makes more sense (overtime possessions start at the 25, therefore...) and because I apparently like being difficult and anti-social from time to time -- should differ at least a little bit from their overall success rates. Sure enough, quite a few teams see pretty drastic differences.
Better near the goal line: Georgia Tech (59.8% red zone success rate, 46.0% overall), North Texas (55.5% red, 44.5% overall), Army (54.8% red, 45.2% overall), Texas State (49.2% red, 39.6% overall).
That Georgia Tech, Army, Air Force, and Navy, all big-time option teams, were all more efficient in the red zone than overall suggests that Fisher DeBerry's "the option's great for this" theory checks out. Other zone-read teams like Texas State, Rice, Ohio State, and FAU ranked pretty high in this regard as well.
Worse near the goal line: Florida (31.8% red, 38.5% overall), Idaho (31.9% red, 37.6% overall), Clemson (43.9% red, 49.2% overall), Notre Dame (38.9% red, 44.2% overall), BYU (36.7% red, 41.9% overall).
There are no major similarities among the teams at the bottom when it comes to offensive identity, but the bottom line is that Red Zone Success Rate appears to be a distinct enough measure that we will use it alongside Success Rate and IsoPPP. Its correlations to Points Per Trip: 0.799 on offense, 0.689 on defense.
(And yes, that means plays in the red zone will be counted twice -- in both the overall and red zone-only piles. So be it. If that becomes a problem, I can change it, but for now I have no problem with it.)
Field goal efficiency
As I did with the special teams portion in the Field Position discussion, I'm using Brian Fremeau's special teams efficiency ratings for anything related to special teams
I still say field goals are failures -- or at least, field goals are an admission that you've already failed and you have to salvage points -- but three points are still better than zero. Your ability to consistently salvage three points after a stalled scoring opportunity matters. But compared to the other factors, it has an minor correlation to Points Per Trip: 0.133 on offense, 0.079 on defense. Your ability to score or prevent seven points trumps the salvaging of the three points, but this is still another unique factor that will play a role in the equation.
The result
Using these four measures -- Success Rate, IsoPPP, Red Zone Success Rate, and FG Efficiency -- I started tinkering. I'm just knowledgable enough to be dangerous when it comes to polynomials in Excel, and using 2013 data only, I was able to craft pretty strong projections for Points Per Trip by crafting an individual projection for each measure (projecting Points Per Trip by using only Success Rate, only IsoPPP, etc.) and using these weights:
- Offense: 28% Red Zone Success Rate, 25% IsoPPP, 20% Success Rate, 27% FG Efficiency. This wasn't the weighting I expected, but it produced a correlation of 0.906 between projected and actual points per trip.
- Defense: 34% IsoPPP, 26% Red Zone Success Rate, 23% Opponents' FG Efficiency, 17% Success Rate. Correlation between projected and actual: 0.858.
In graph form, here's how the projected and actual averages match up.
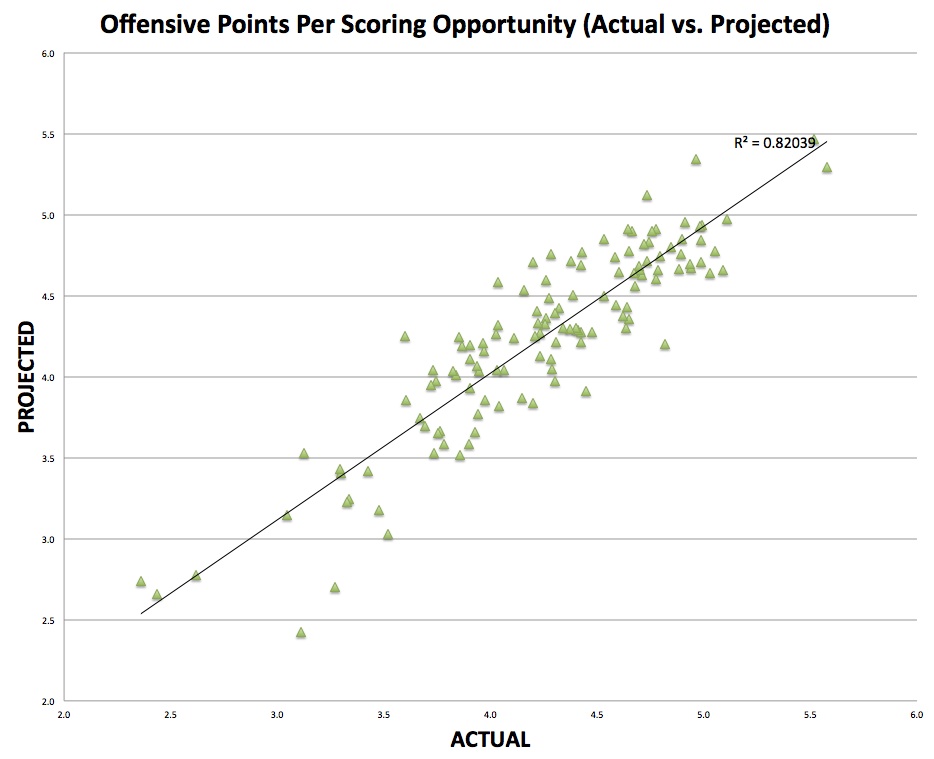
You see some leakiness at the bottom there, where a small handful of (really bad) teams were quite a bit worse than projected, but sans an outlier here or there, this matches up quite well.
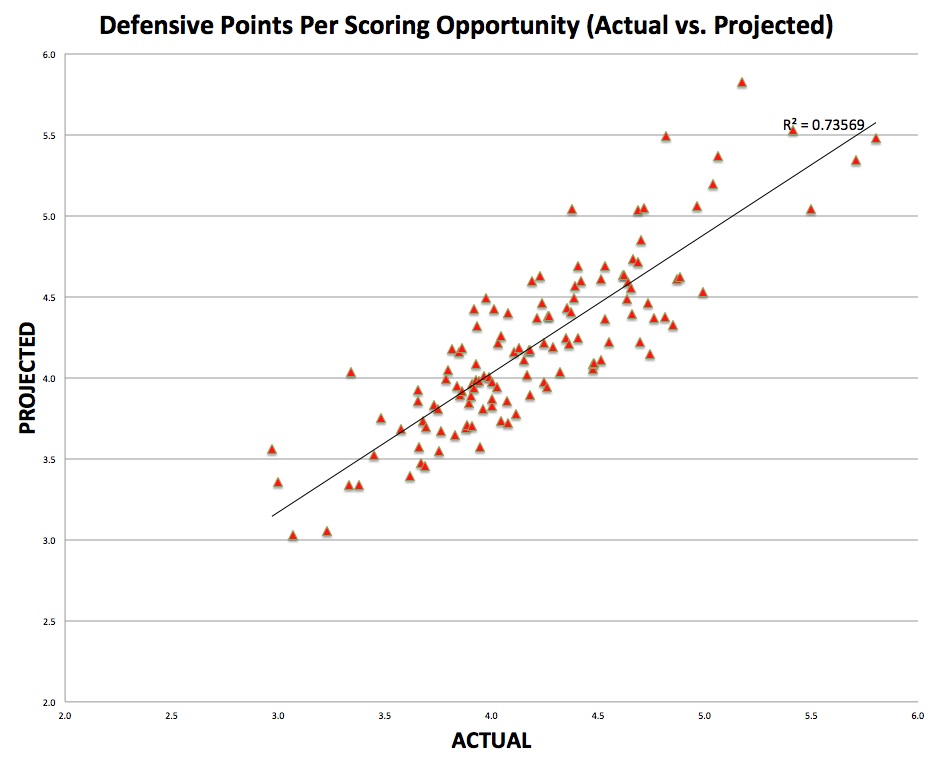
Again, there's some leakiness on the bad end of the scale, but it goes in the opposite direction this time -- certain teams were projected much worse than they actually were.
If you look at the original correlation coefficients, the weights I applied are a little bit of a surprise. IsoPPP has a weaker correlation to points per trip than Success Rate, but it has a stronger weight; meanwhile, field goals had a tiny correlation but a weight nearly equal to (or higher than) other measures. To me, the biggest reason for this is uniqueness. Using both Success Rate and Red Zone Success Rate is redundant but, in my mind, necessary; in the end, one form or another of success rate makes up 48 percent of the offensive formula and 43 percent of the defensive formula, so it's still the primary factor.
The importance of explosiveness is interesting. Basically, the magnitude of your big plays is a huge factor in your ability to finish drives -- are you breaking a 20-yard run to your opponent's 30, or are you taking that play 50 yards to the house? Defenses play bend-don't-break for a reason: every extra play you have to run on offense is an extra opportunity to fail. The teams with the biggest big plays derive a scoring advantage here.
I found it interesting that, while the approximate weighting for Success Rate, Red Zone Success Rate, and FG Efficiency were pretty similar in terms of offense versus defense, the explosiveness measure, IsoPPP, matters much more on the defensive side of the ball. I'm not exactly sure what to conclude from that -- it could potentially mean that red zone execution differs from offense to offense more than defense to defense, and that the best red zone defense is simply stopping big plays from getting too big. Or it could mean nothing at all.
Limitations
There are still some factors here that my use of four categories doesn't cover.
Turnovers. Notre Dame fans probably still remember the 2011 Irish and their strangely impressive ability to turn the ball over in the end zone. Turnovers play a role elsewhere in the Five Factors discussion, and at some point I could look into red zone turnovers, but I am foregoing that thought for now. Still, a team particularly prone to errors like this near the end zone could end up with their projections at odds with reality.
You don't really control opponents' field goals. Sure, you can block some, but no team blocks so many that it's going to have a major impact. Brian Fremeau doesn't factor Opponents FG Efficiency into his special teams ratings, and for good reason -- it's quite random.
Inconsistent definitions. As you may have noticed above, I use Points Per Trip Inside the 40 for my go-to measure of scoring opportunities, but my Red Zone Success Rate measure counts plays inside the 25. Again, I'm using that because that's what I've always used, and because changing nine years' worth of spreadsheets to account for a new definition is a pain in the ass. If this pursuit turns out worthwhile -- and I kind of assume it will -- I will change my red zone definition accordingly.
The data
It's time for a data dump! Below are the major offensive and defensive components I referenced above: success rates, IsoPPP, FG efficiency, and both projected and actual points per trip.
There are still some outliers here and there, but again, I'm pretty excited about how this came together.
| Rk | Offense | Points per trip | Success Rt. | IsoPPP | Red Zone Success Rt. | FG Eff. | Proj. Pts/Trip | Diff |
| 1 | Ohio State | 5.58 | 53.8% | 1.20 | 61.7% | 0.399 | 5.29 | 0.29 |
| 2 | Florida State | 5.52 | 54.5% | 1.39 | 56.0% | 0.687 | 5.47 | 0.05 |
| 3 | Auburn | 5.11 | 49.8% | 1.23 | 50.2% | 0.182 | 4.97 | 0.14 |
| 4 | Marshall | 5.09 | 46.7% | 1.16 | 48.6% | -0.330 | 4.66 | 0.43 |
| 5 | Colorado State | 5.05 | 44.9% | 1.18 | 49.5% | 0.511 | 4.78 | 0.27 |
| 6 | Wyoming | 5.03 | 43.2% | 1.22 | 49.0% | -0.089 | 4.64 | 0.39 |
| 7 | LSU | 4.99 | 46.8% | 1.33 | 46.6% | 0.709 | 4.94 | 0.05 |
| 8 | South Carolina | 4.99 | 46.4% | 1.22 | 49.5% | 0.288 | 4.85 | 0.14 |
| 9 | Navy | 4.99 | 50.2% | 1.00 | 56.2% | -0.074 | 4.71 | 0.28 |
| 10 | Oregon | 4.98 | 51.1% | 1.38 | 46.4% | -0.235 | 4.93 | 0.05 |
| 11 | Texas A&M | 4.96 | 55.5% | 1.23 | 60.0% | 0.372 | 5.34 | -0.38 |
| 12 | UL-Lafayette | 4.94 | 46.5% | 1.16 | 49.4% | -0.463 | 4.67 | 0.27 |
| 13 | Indiana | 4.93 | 45.0% | 1.36 | 45.1% | 0.079 | 4.69 | 0.24 |
| 14 | Baylor | 4.91 | 47.1% | 1.39 | 49.8% | -0.176 | 4.96 | -0.04 |
| 15 | Georgia Tech | 4.90 | 46.0% | 1.10 | 59.8% | 0.089 | 4.85 | 0.05 |
| 16 | New Mexico | 4.89 | 44.9% | 1.26 | 49.6% | -0.294 | 4.76 | 0.13 |
| 17 | East Carolina | 4.88 | 49.0% | 1.10 | 49.6% | -0.389 | 4.67 | 0.22 |
| 18 | Washington | 4.84 | 45.3% | 1.15 | 50.2% | 0.671 | 4.80 | 0.04 |
| 19 | Boston College | 4.82 | 38.0% | 1.34 | 39.6% | 0.844 | 4.20 | 0.62 |
| 20 | Louisville | 4.79 | 50.6% | 1.16 | 46.6% | 0.086 | 4.74 | 0.05 |
| 21 | UCLA | 4.79 | 44.4% | 1.19 | 49.0% | -0.056 | 4.66 | 0.13 |
| 22 | Nebraska | 4.78 | 45.1% | 1.06 | 49.7% | 0.610 | 4.60 | 0.17 |
| 23 | Fresno State | 4.77 | 48.6% | 1.20 | 52.0% | -0.153 | 4.91 | -0.14 |
| 24 | Georgia | 4.76 | 46.2% | 1.26 | 47.8% | 0.671 | 4.90 | -0.14 |
| 25 | Ball State | 4.74 | 50.5% | 1.18 | 46.8% | 0.351 | 4.83 | -0.09 |
| Rk | Offense | Points per trip | Success Rt. | IsoPPP | Red Zone Success Rt. | FG Eff. | Proj. Pts/Trip | Diff |
| 26 | Alabama | 4.73 | 51.1% | 1.26 | 55.4% | -0.352 | 5.12 | -0.39 |
| 27 | Clemson | 4.73 | 49.2% | 1.23 | 43.9% | 0.374 | 4.71 | 0.02 |
| 28 | Bowling Green | 4.72 | 49.7% | 1.18 | 47.5% | 0.265 | 4.82 | -0.10 |
| 29 | Arizona State | 4.71 | 45.7% | 1.21 | 45.5% | 0.220 | 4.63 | 0.09 |
| 30 | Troy | 4.70 | 44.1% | 1.23 | 47.9% | 0.003 | 4.66 | 0.04 |
| 31 | Oklahoma State | 4.69 | 45.5% | 1.17 | 50.8% | -0.773 | 4.68 | 0.01 |
| 32 | Army | 4.68 | 45.2% | 1.01 | 54.8% | 0.119 | 4.56 | 0.12 |
| 33 | San Jose State | 4.67 | 46.6% | 1.23 | 44.4% | 0.315 | 4.64 | 0.03 |
| 34 | Northern Illinois | 4.66 | 49.5% | 1.17 | 52.8% | -0.298 | 4.90 | -0.24 |
| 35 | Arizona | 4.65 | 46.6% | 1.04 | 46.5% | -0.172 | 4.36 | 0.29 |
| 36 | Missouri | 4.65 | 45.8% | 1.26 | 48.3% | -0.032 | 4.78 | -0.13 |
| 37 | Central Florida | 4.64 | 49.3% | 1.23 | 47.3% | 0.507 | 4.91 | -0.27 |
| 38 | North Carolina | 4.64 | 44.9% | 1.13 | 46.5% | -0.526 | 4.43 | 0.21 |
| 39 | Pittsburgh | 4.63 | 43.7% | 1.09 | 44.9% | 0.115 | 4.30 | 0.33 |
| 40 | Vanderbilt | 4.62 | 43.0% | 1.01 | 50.5% | 0.352 | 4.37 | 0.25 |
| 41 | Air Force | 4.60 | 46.5% | 0.98 | 54.7% | 0.711 | 4.65 | -0.05 |
| 42 | Michigan | 4.59 | 41.3% | 1.21 | 46.0% | 0.099 | 4.44 | 0.14 |
| 43 | Duke | 4.58 | 45.2% | 1.12 | 52.9% | 0.137 | 4.74 | -0.16 |
| 44 | Rice | 4.53 | 41.1% | 1.13 | 49.7% | 0.288 | 4.50 | 0.04 |
| 44 | Kansas State | 4.53 | 48.2% | 1.23 | 48.2% | 0.156 | 4.85 | -0.31 |
| 46 | UNLV | 4.48 | 44.9% | 1.10 | 44.3% | -0.806 | 4.28 | 0.20 |
| 47 | Utah | 4.45 | 36.9% | 1.26 | 38.3% | 0.521 | 3.91 | 0.54 |
| 48 | Toledo | 4.43 | 49.0% | 1.08 | 48.2% | 0.786 | 4.77 | -0.34 |
| 49 | Boise State | 4.43 | 46.4% | 1.16 | 47.4% | 0.378 | 4.69 | -0.27 |
| 50 | Texas Tech | 4.43 | 45.1% | 1.16 | 40.7% | 0.183 | 4.28 | 0.15 |
| Rk | Offense | Points per trip | Success Rt. | IsoPPP | Red Zone Success Rt. | FG Eff. | Proj. Pts/Trip | Diff |
| 51 | Florida Atlantic | 4.42 | 39.8% | 1.10 | 47.5% | -0.193 | 4.22 | 0.21 |
| 52 | Nevada | 4.41 | 43.9% | 1.06 | 45.0% | 0.274 | 4.29 | 0.12 |
| 53 | Buffalo | 4.40 | 42.2% | 1.06 | 47.4% | 0.131 | 4.30 | 0.10 |
| 54 | UTSA | 4.38 | 45.6% | 1.12 | 47.8% | -0.504 | 4.50 | -0.12 |
| 55 | Temple | 4.38 | 45.8% | 1.12 | 53.3% | -1.375 | 4.72 | -0.34 |
| 56 | Texas State | 4.37 | 39.6% | 1.09 | 49.2% | 0.043 | 4.29 | 0.08 |
| 57 | Arkansas State | 4.34 | 43.7% | 1.06 | 45.4% | 0.320 | 4.30 | 0.04 |
| 58 | Illinois | 4.32 | 45.9% | 1.17 | 43.3% | -0.098 | 4.43 | -0.11 |
| 59 | Michigan State | 4.31 | 41.6% | 1.08 | 44.3% | 0.363 | 4.21 | 0.09 |
| 60 | Iowa State | 4.30 | 38.8% | 1.05 | 45.3% | -0.139 | 3.98 | 0.33 |
| 61 | Washington State | 4.30 | 41.5% | 1.18 | 44.4% | 0.418 | 4.39 | -0.09 |
| 62 | Oklahoma | 4.29 | 42.7% | 1.15 | 38.0% | 0.537 | 4.05 | 0.24 |
| 63 | Wisconsin | 4.28 | 48.0% | 1.25 | 46.6% | -0.127 | 4.76 | -0.47 |
| 64 | Utah State | 4.28 | 39.4% | 1.15 | 43.3% | 0.003 | 4.11 | 0.17 |
| 65 | Miami-FL | 4.27 | 44.5% | 1.38 | 41.2% | 0.068 | 4.48 | -0.21 |
| 66 | Cincinnati | 4.26 | 47.5% | 1.09 | 44.1% | -1.286 | 4.36 | -0.11 |
| 66 | Oregon State | 4.26 | 45.1% | 1.22 | 45.6% | 0.041 | 4.59 | -0.34 |
| 68 | Stanford | 4.26 | 44.7% | 1.21 | 41.2% | -0.089 | 4.32 | -0.07 |
| 69 | New Mexico State | 4.23 | 40.7% | 1.10 | 45.9% | 0.331 | 4.27 | -0.04 |
| 70 | Middle Tennessee | 4.23 | 42.6% | 1.11 | 41.9% | -0.028 | 4.13 | 0.11 |
| 71 | Minnesota | 4.22 | 40.9% | 1.08 | 48.5% | 0.247 | 4.33 | -0.11 |
| 72 | USC | 4.22 | 41.1% | 1.22 | 45.6% | -0.091 | 4.40 | -0.19 |
| 73 | South Alabama | 4.21 | 43.7% | 1.21 | 39.8% | 0.300 | 4.25 | -0.04 |
| 74 | Texas | 4.20 | 39.4% | 1.11 | 37.9% | 0.624 | 3.84 | 0.36 |
| 74 | Western Kentucky | 4.20 | 49.3% | 1.12 | 48.1% | 0.173 | 4.71 | -0.51 |
| Rk | Offense | Points per trip | Success Rt. | IsoPPP | Red Zone Success Rt. | FG Eff. | Proj. Pts/Trip | Diff |
| 76 | Ole Miss | 4.16 | 44.5% | 1.18 | 46.3% | -0.081 | 4.53 | -0.38 |
| 77 | Wake Forest | 4.15 | 38.5% | 1.02 | 44.1% | 0.171 | 3.87 | 0.28 |
| 78 | UAB | 4.11 | 39.2% | 1.29 | 42.5% | 0.042 | 4.24 | -0.13 |
| 79 | Houston | 4.06 | 39.6% | 1.29 | 39.6% | -0.484 | 4.04 | 0.02 |
| 80 | Syracuse | 4.04 | 39.2% | 1.07 | 41.5% | -0.381 | 3.82 | 0.22 |
| 81 | North Texas | 4.03 | 44.5% | 1.06 | 55.5% | -0.673 | 4.58 | -0.55 |
| 82 | Kentucky | 4.03 | 39.1% | 1.17 | 46.3% | 0.326 | 4.32 | -0.29 |
| 83 | Tulane | 4.03 | 37.6% | 1.05 | 46.9% | 0.296 | 4.04 | -0.01 |
| 84 | Penn State | 4.02 | 44.0% | 1.05 | 45.8% | -0.124 | 4.26 | -0.24 |
| 85 | SMU | 3.97 | 41.5% | 1.14 | 36.9% | 0.312 | 3.86 | 0.12 |
| 86 | Arkansas | 3.97 | 42.9% | 1.10 | 40.6% | 0.647 | 4.16 | -0.19 |
| 87 | Notre Dame | 3.96 | 44.2% | 1.22 | 38.9% | 0.116 | 4.21 | -0.24 |
| 88 | San Diego State | 3.95 | 39.1% | 1.31 | 39.8% | -1.122 | 4.04 | -0.09 |
| 89 | Colorado | 3.94 | 38.8% | 1.15 | 37.4% | 0.317 | 3.77 | 0.17 |
| 90 | Maryland | 3.94 | 38.9% | 1.37 | 38.4% | 0.255 | 4.06 | -0.13 |
| 91 | Hawaii | 3.93 | 39.5% | 1.13 | 36.9% | -0.511 | 3.66 | 0.27 |
| 92 | Ohio | 3.90 | 39.6% | 1.26 | 41.7% | 0.100 | 4.19 | -0.29 |
| 93 | Mississippi State | 3.90 | 44.2% | 1.16 | 39.8% | -0.966 | 4.11 | -0.20 |
| 94 | UTEP | 3.90 | 38.7% | 1.14 | 42.1% | -0.777 | 3.93 | -0.03 |
| 95 | Connecticut | 3.90 | 36.9% | 1.05 | 40.0% | -0.143 | 3.58 | 0.31 |
| 96 | Northwestern | 3.86 | 45.9% | 1.02 | 42.5% | 0.460 | 4.19 | -0.33 |
| 97 | UL-Monroe | 3.85 | 37.0% | 1.17 | 36.3% | -0.960 | 3.52 | 0.34 |
| 98 | Rutgers | 3.85 | 40.1% | 1.23 | 43.6% | -0.193 | 4.25 | -0.39 |
| 99 | TCU | 3.84 | 39.6% | 1.08 | 41.9% | 0.495 | 4.01 | -0.17 |
| 100 | Akron | 3.82 | 38.6% | 1.14 | 43.8% | -0.322 | 4.04 | -0.21 |
| Rk | Offense | Points per trip | Success Rt. | IsoPPP | Red Zone Success Rt. | FG Eff. | Proj. Pts/Trip | Diff |
| 101 | Virginia Tech | 3.78 | 38.0% | 1.12 | 37.2% | -0.359 | 3.58 | 0.20 |
| 102 | Eastern Michigan | 3.76 | 40.2% | 1.09 | 37.5% | -0.480 | 3.66 | 0.10 |
| 103 | West Virginia | 3.75 | 36.4% | 1.26 | 35.7% | 0.301 | 3.65 | 0.10 |
| 104 | Iowa | 3.74 | 43.0% | 0.98 | 43.9% | 0.045 | 3.97 | -0.23 |
| 105 | Georgia State | 3.74 | 35.0% | 1.21 | 36.3% | 0.199 | 3.53 | 0.21 |
| 106 | Memphis | 3.73 | 38.2% | 1.05 | 44.4% | 0.672 | 4.04 | -0.31 |
| 107 | Central Michigan | 3.72 | 42.2% | 1.15 | 38.8% | -0.355 | 3.95 | -0.23 |
| 108 | Kent State | 3.69 | 39.3% | 1.11 | 38.5% | -0.767 | 3.70 | 0.00 |
| 109 | California | 3.67 | 38.2% | 1.16 | 36.4% | 0.631 | 3.74 | -0.08 |
| 110 | BYU | 3.60 | 41.9% | 1.16 | 36.7% | 0.083 | 3.85 | -0.25 |
| 111 | Tennessee | 3.60 | 41.7% | 1.08 | 44.9% | 0.383 | 4.25 | -0.65 |
| 112 | Florida | 3.52 | 38.5% | 1.03 | 31.8% | -0.428 | 3.03 | 0.49 |
| 113 | Idaho | 3.48 | 37.6% | 1.13 | 31.9% | -0.343 | 3.18 | 0.30 |
| 114 | Western Michigan | 3.42 | 36.0% | 1.08 | 37.1% | -0.009 | 3.42 | 0.00 |
| 115 | Tulsa | 3.34 | 37.2% | 1.00 | 35.9% | 0.123 | 3.24 | 0.10 |
| 116 | NC State | 3.33 | 37.4% | 1.09 | 32.7% | 0.187 | 3.22 | 0.10 |
| 117 | Purdue | 3.30 | 36.6% | 0.99 | 40.4% | -0.628 | 3.41 | -0.11 |
| 118 | Virginia | 3.30 | 35.5% | 0.98 | 40.4% | 0.317 | 3.43 | -0.14 |
| 119 | Kansas | 3.27 | 33.6% | 1.03 | 31.4% | -0.127 | 2.71 | 0.57 |
| 120 | Louisiana Tech | 3.13 | 37.9% | 1.12 | 35.8% | 0.111 | 3.53 | -0.40 |
| 121 | Miami-OH | 3.11 | 33.3% | 0.85 | 33.3% | 0.250 | 2.42 | 0.69 |
| 122 | Southern Miss | 3.05 | 34.4% | 1.20 | 32.8% | -0.426 | 3.15 | -0.10 |
| 123 | South Florida | 2.62 | 28.8% | 1.11 | 32.8% | 0.699 | 2.78 | -0.16 |
| 124 | Massachusetts | 2.44 | 36.0% | 0.94 | 31.3% | -0.071 | 2.66 | -0.22 |
| 125 | Florida International | 2.36 | 30.5% | 1.00 | 35.2% | 0.048 | 2.74 | -0.38 |
And for defense:
| Rk | Defense | Points per trip | Success Rt. | IsoPPP | Red Zone Success Rt. | FG Eff. | Proj. Pts/Trip | Diff |
| 1 | North Texas | 2.97 | 36.4% | 1.14 | 35.8% | -0.640 | 3.56 | -0.59 |
| 2 | Louisville | 3.00 | 34.2% | 1.09 | 34.5% | 0.218 | 3.36 | -0.36 |
| 3 | Utah State | 3.07 | 36.9% | 1.05 | 28.0% | -0.069 | 3.03 | 0.04 |
| 4 | Florida State | 3.23 | 32.5% | 1.03 | 31.2% | -0.424 | 3.05 | 0.17 |
| 5 | Oklahoma State | 3.33 | 35.9% | 1.08 | 33.9% | 0.064 | 3.34 | -0.01 |
| 6 | Bowling Green | 3.34 | 42.2% | 1.07 | 46.0% | -0.467 | 4.04 | -0.70 |
| 7 | Michigan State | 3.38 | 29.1% | 1.16 | 34.0% | 0.020 | 3.34 | 0.04 |
| 8 | Wisconsin | 3.45 | 37.8% | 1.04 | 37.7% | 0.082 | 3.52 | -0.07 |
| 9 | Houston | 3.48 | 42.0% | 1.05 | 40.1% | -0.145 | 3.75 | -0.27 |
| 10 | Alabama | 3.57 | 37.4% | 1.09 | 39.1% | 0.418 | 3.68 | -0.11 |
| 11 | BYU | 3.62 | 35.6% | 1.09 | 34.4% | 0.251 | 3.39 | 0.22 |
| 12 | Memphis | 3.65 | 40.5% | 1.08 | 42.5% | -0.049 | 3.86 | -0.20 |
| 13 | South Carolina | 3.66 | 40.8% | 1.12 | 42.5% | -0.083 | 3.92 | -0.27 |
| 14 | Wake Forest | 3.66 | 40.5% | 1.04 | 37.4% | -0.132 | 3.57 | 0.09 |
| 15 | TCU | 3.67 | 32.6% | 1.23 | 29.9% | 0.278 | 3.47 | 0.20 |
| 16 | Minnesota | 3.68 | 42.9% | 1.12 | 36.8% | -0.216 | 3.73 | -0.05 |
| 17 | Tulane | 3.69 | 35.7% | 1.21 | 30.4% | -0.655 | 3.46 | 0.23 |
| 18 | Oregon | 3.69 | 38.3% | 1.04 | 40.9% | 0.229 | 3.70 | -0.01 |
| 19 | Stanford | 3.73 | 39.0% | 1.06 | 42.1% | 0.469 | 3.83 | -0.10 |
| 20 | Ball State | 3.75 | 43.4% | 1.08 | 39.0% | 0.122 | 3.81 | -0.06 |
| 21 | USC | 3.75 | 34.0% | 1.14 | 37.1% | -0.642 | 3.55 | 0.20 |
| 22 | Michigan | 3.76 | 42.6% | 1.09 | 35.9% | 0.237 | 3.67 | 0.09 |
| 23 | Utah | 3.78 | 38.0% | 1.24 | 38.0% | 0.273 | 3.99 | -0.21 |
| 24 | UTSA | 3.80 | 44.1% | 0.98 | 46.1% | -0.034 | 4.05 | -0.25 |
| 25 | Buffalo | 3.81 | 38.0% | 1.28 | 38.9% | -0.111 | 4.18 | -0.37 |
| Rk | Defense | Points per trip | Success Rt. | IsoPPP | Red Zone Success Rt. | FG Eff. | Proj. Pts/Trip | Diff |
| 26 | Washington | 3.83 | 39.9% | 1.05 | 38.9% | 0.145 | 3.65 | 0.18 |
| 27 | Arizona | 3.84 | 38.6% | 1.13 | 42.9% | 0.321 | 3.95 | -0.11 |
| 28 | UL-Lafayette | 3.85 | 44.8% | 1.20 | 39.4% | 0.214 | 4.16 | -0.31 |
| 29 | Kansas State | 3.85 | 43.2% | 0.98 | 43.2% | -0.032 | 3.89 | -0.04 |
| 30 | Louisiana Tech | 3.86 | 41.0% | 1.08 | 49.4% | 0.233 | 4.19 | -0.33 |
| 31 | Notre Dame | 3.86 | 45.2% | 0.96 | 42.3% | -0.090 | 3.92 | -0.06 |
| 32 | Boise State | 3.88 | 42.4% | 1.04 | 38.8% | -0.111 | 3.69 | 0.19 |
| 33 | North Carolina | 3.88 | 42.2% | 1.06 | 37.9% | 0.273 | 3.71 | 0.18 |
| 34 | Northwestern | 3.90 | 44.6% | 1.02 | 40.2% | 0.109 | 3.84 | 0.05 |
| 35 | Oklahoma | 3.90 | 39.5% | 1.20 | 37.4% | 0.269 | 3.89 | 0.01 |
| 36 | Virginia Tech | 3.91 | 32.1% | 1.22 | 40.7% | 0.533 | 3.96 | -0.05 |
| 37 | Texas | 3.91 | 41.0% | 1.20 | 32.3% | 0.158 | 3.70 | 0.21 |
| 38 | Georgia Tech | 3.92 | 43.9% | 1.16 | 50.0% | -0.115 | 4.42 | -0.50 |
| 39 | Northern Illinois | 3.92 | 43.6% | 1.09 | 41.0% | 0.206 | 3.93 | -0.01 |
| 40 | Connecticut | 3.93 | 39.3% | 1.23 | 39.9% | 0.291 | 4.08 | -0.16 |
| 41 | Auburn | 3.93 | 43.3% | 1.21 | 36.7% | 0.080 | 3.98 | -0.06 |
| 42 | South Florida | 3.93 | 43.4% | 1.10 | 50.3% | -0.657 | 4.32 | -0.39 |
| 43 | Nebraska | 3.94 | 42.6% | 1.09 | 42.7% | 0.291 | 3.98 | -0.04 |
| 44 | East Carolina | 3.95 | 37.9% | 1.05 | 38.9% | -0.053 | 3.57 | 0.37 |
| 45 | Marshall | 3.96 | 38.7% | 1.07 | 43.2% | -0.042 | 3.81 | 0.15 |
| 46 | Missouri | 3.96 | 42.7% | 1.07 | 44.1% | 0.290 | 4.01 | -0.05 |
| 47 | Middle Tennessee | 3.98 | 46.6% | 0.96 | 54.7% | -0.020 | 4.49 | -0.52 |
| 48 | Penn State | 3.99 | 38.6% | 1.17 | 43.0% | -0.011 | 4.00 | -0.02 |
| 49 | Cincinnati | 4.00 | 38.5% | 1.02 | 45.0% | -0.234 | 3.82 | 0.18 |
| 49 | Florida Atlantic | 4.00 | 34.5% | 1.18 | 38.9% | 0.737 | 3.87 | 0.13 |
| Rk | Defense | Points per trip | Success Rt. | IsoPPP | Red Zone Success Rt. | FG Eff. | Proj. Pts/Trip | Diff |
| 49 | Florida | 4.00 | 37.9% | 1.21 | 37.5% | 0.680 | 3.97 | 0.03 |
| 52 | Ole Miss | 4.01 | 43.2% | 1.05 | 54.0% | 0.315 | 4.42 | -0.41 |
| 53 | Vanderbilt | 4.03 | 43.2% | 1.04 | 43.6% | -0.047 | 3.94 | 0.08 |
| 54 | Central Florida | 4.03 | 40.4% | 1.18 | 45.2% | 0.263 | 4.21 | -0.18 |
| 55 | UCLA | 4.04 | 43.9% | 0.95 | 51.2% | -0.001 | 4.26 | -0.21 |
| 55 | Baylor | 4.04 | 37.5% | 1.18 | 37.2% | -0.153 | 3.73 | 0.31 |
| 57 | Iowa | 4.07 | 37.7% | 0.97 | 44.9% | 0.438 | 3.86 | 0.21 |
| 58 | LSU | 4.07 | 42.1% | 1.04 | 39.1% | 0.106 | 3.72 | 0.36 |
| 59 | Central Michigan | 4.08 | 47.8% | 1.08 | 48.4% | 0.226 | 4.40 | -0.32 |
| 60 | Colorado State | 4.10 | 38.9% | 1.26 | 39.6% | 0.204 | 4.16 | -0.05 |
| 61 | Maryland | 4.11 | 39.3% | 1.12 | 38.7% | 0.415 | 3.78 | 0.34 |
| 62 | South Alabama | 4.13 | 42.0% | 1.13 | 45.9% | 0.310 | 4.18 | -0.05 |
| 63 | Western Kentucky | 4.15 | 40.5% | 1.12 | 47.0% | -0.065 | 4.11 | 0.04 |
| 64 | Rice | 4.16 | 36.8% | 1.20 | 42.9% | -0.310 | 4.02 | 0.15 |
| 65 | Duke | 4.18 | 44.6% | 1.06 | 47.4% | -0.431 | 4.17 | 0.00 |
| 66 | Texas State | 4.18 | 40.1% | 1.10 | 43.0% | -0.067 | 3.89 | 0.28 |
| 67 | Washington State | 4.18 | 44.5% | 1.19 | 40.7% | 0.132 | 4.17 | 0.01 |
| 68 | SMU | 4.19 | 47.6% | 1.05 | 55.4% | -0.245 | 4.60 | -0.41 |
| 69 | Fresno State | 4.21 | 39.6% | 1.24 | 45.5% | -0.005 | 4.37 | -0.15 |
| 70 | Miami-OH | 4.23 | 53.6% | 1.06 | 49.4% | -0.538 | 4.63 | -0.40 |
| 71 | Massachusetts | 4.24 | 47.5% | 1.19 | 43.9% | 0.347 | 4.46 | -0.23 |
| 72 | Pittsburgh | 4.25 | 39.6% | 1.20 | 38.8% | 0.259 | 3.97 | 0.27 |
| 73 | Texas Tech | 4.25 | 42.9% | 1.14 | 45.9% | 0.272 | 4.21 | 0.03 |
| 74 | Miami-FL | 4.26 | 44.2% | 1.11 | 40.5% | 0.065 | 3.95 | 0.31 |
| 75 | Navy | 4.26 | 50.6% | 0.93 | 47.9% | -0.145 | 4.38 | -0.12 |
| Rk | Defense | Points per trip | Success Rt. | IsoPPP | Red Zone Success Rt. | FG Eff. | Proj. Pts/Trip | Diff |
| 76 | Temple | 4.27 | 46.3% | 1.24 | 40.8% | -0.084 | 4.38 | -0.11 |
| 77 | Kansas | 4.29 | 42.7% | 1.15 | 45.1% | 0.180 | 4.19 | 0.09 |
| 78 | Akron | 4.32 | 40.6% | 1.14 | 44.4% | -0.220 | 4.04 | 0.28 |
| 79 | Mississippi State | 4.35 | 41.3% | 1.16 | 46.2% | 0.381 | 4.25 | 0.10 |
| 80 | West Virginia | 4.36 | 40.7% | 1.26 | 44.4% | 0.096 | 4.43 | -0.08 |
| 81 | Syracuse | 4.36 | 41.2% | 1.15 | 46.3% | 0.270 | 4.21 | 0.16 |
| 82 | UNLV | 4.37 | 43.1% | 1.21 | 46.5% | -0.009 | 4.41 | -0.03 |
| 83 | Nevada | 4.38 | 49.7% | 1.26 | 51.6% | 0.068 | 5.04 | -0.67 |
| 84 | UL-Monroe | 4.39 | 43.5% | 1.18 | 47.7% | 0.629 | 4.49 | -0.11 |
| 85 | Kent State | 4.39 | 46.5% | 1.17 | 49.1% | 0.307 | 4.57 | -0.17 |
| 86 | Iowa State | 4.40 | 43.9% | 1.17 | 43.5% | 0.412 | 4.25 | 0.16 |
| 87 | Arizona State | 4.41 | 36.5% | 1.33 | 46.6% | 0.006 | 4.69 | -0.28 |
| 88 | Arkansas | 4.42 | 48.3% | 1.15 | 50.3% | -0.507 | 4.59 | -0.18 |
| 89 | Georgia | 4.47 | 40.8% | 1.16 | 43.5% | 0.052 | 4.06 | 0.42 |
| 90 | Tulsa | 4.48 | 42.1% | 1.13 | 44.2% | 0.117 | 4.09 | 0.39 |
| 91 | Arkansas State | 4.48 | 43.8% | 1.18 | 41.0% | -0.142 | 4.09 | 0.39 |
| 92 | Georgia State | 4.51 | 47.6% | 1.16 | 50.8% | 0.034 | 4.61 | -0.10 |
| 93 | Ohio State | 4.51 | 42.7% | 1.09 | 46.2% | 0.044 | 4.11 | 0.41 |
| 94 | Western Michigan | 4.53 | 46.9% | 1.10 | 48.8% | -0.368 | 4.36 | 0.17 |
| 95 | Illinois | 4.53 | 47.9% | 1.21 | 48.7% | -0.009 | 4.69 | -0.16 |
| 96 | Clemson | 4.55 | 34.0% | 1.32 | 38.4% | 0.177 | 4.22 | 0.33 |
| 97 | Wyoming | 4.62 | 47.0% | 1.13 | 53.6% | -0.688 | 4.63 | -0.02 |
| 98 | Tennessee | 4.62 | 43.2% | 1.28 | 46.4% | -0.489 | 4.63 | -0.01 |
| 99 | Kentucky | 4.63 | 48.4% | 1.12 | 49.4% | -0.218 | 4.48 | 0.15 |
| 100 | San Jose State | 4.64 | 48.2% | 1.17 | 48.8% | 0.051 | 4.59 | 0.05 |
| Rk | Defense | Points per trip | Success Rt. | IsoPPP | Red Zone Success Rt. | FG Eff. | Proj. Pts/Trip | Diff |
| 101 | Colorado | 4.66 | 43.6% | 1.26 | 44.0% | 0.446 | 4.55 | 0.10 |
| 102 | Boston College | 4.66 | 43.2% | 1.16 | 46.8% | 0.567 | 4.39 | 0.27 |
| 103 | Hawaii | 4.66 | 42.8% | 1.26 | 48.4% | 0.577 | 4.73 | -0.07 |
| 104 | NC State | 4.68 | 43.4% | 1.22 | 52.1% | 0.320 | 4.72 | -0.03 |
| 105 | Army | 4.69 | 48.5% | 1.26 | 50.6% | 0.416 | 5.03 | -0.35 |
| 106 | Toledo | 4.69 | 47.2% | 1.03 | 47.1% | -0.270 | 4.22 | 0.47 |
| 107 | Florida International | 4.70 | 45.4% | 1.30 | 47.7% | -0.168 | 4.85 | -0.15 |
| 108 | Troy | 4.72 | 42.6% | 1.40 | 43.1% | -0.485 | 5.05 | -0.33 |
| 109 | Indiana | 4.73 | 49.4% | 1.18 | 44.4% | -0.534 | 4.46 | 0.27 |
| 110 | Ohio | 4.74 | 41.7% | 1.18 | 43.5% | -0.104 | 4.15 | 0.60 |
| 111 | Rutgers | 4.76 | 41.8% | 1.21 | 46.7% | -0.167 | 4.37 | 0.40 |
| 112 | San Diego State | 4.81 | 39.8% | 1.13 | 52.0% | 0.378 | 4.37 | 0.44 |
| 113 | New Mexico State | 4.82 | 49.6% | 1.36 | 50.3% | 0.401 | 5.49 | -0.68 |
| 114 | Oregon State | 4.85 | 42.3% | 1.26 | 40.4% | 0.347 | 4.33 | 0.53 |
| 115 | Texas A&M | 4.87 | 46.2% | 1.24 | 46.4% | 0.033 | 4.61 | 0.26 |
| 116 | Virginia | 4.88 | 37.9% | 1.36 | 41.1% | 0.062 | 4.62 | 0.26 |
| 117 | Purdue | 4.96 | 51.9% | 1.05 | 59.9% | 0.574 | 5.06 | -0.10 |
| 118 | Southern Miss | 4.99 | 44.2% | 1.13 | 53.7% | -0.255 | 4.53 | 0.46 |
| 119 | Idaho | 5.04 | 48.3% | 1.28 | 54.4% | 0.103 | 5.19 | -0.16 |
| 120 | California | 5.06 | 44.8% | 1.42 | 44.9% | 0.138 | 5.37 | -0.31 |
| 121 | Eastern Michigan | 5.17 | 49.7% | 1.41 | 52.3% | 0.357 | 5.83 | -0.65 |
| 122 | UTEP | 5.41 | 48.5% | 1.39 | 50.3% | 0.036 | 5.53 | -0.12 |
| 123 | Air Force | 5.50 | 54.8% | 1.07 | 58.1% | -0.343 | 5.04 | 0.46 |
| 124 | New Mexico | 5.71 | 51.8% | 1.28 | 51.9% | 0.563 | 5.35 | 0.36 |
| 125 | UAB | 5.80 | 48.6% | 1.34 | 55.8% | -0.201 | 5.48 | 0.32 |
Something to watch
Because I'm always looking for ways to figure out which teams were lucky or unlucky, too efficient or too inefficient, from year to year, I thought it would be interesting to look at which teams varied the most from their projections. Because we know how many trips teams (and their opponents) made inside the 40, we can calculate the overall difference between projections and reality when it comes to points scored and allowed, and we can turn that into a Points Per Game figure.
Here are the 2013 FBS teams ranked in order of their per-game difference between projection and reality.
| Team | Points Gained or Lost on Offense | Rk | Points Gained or Lost on Defense | Rk | Total Points Per Game Gained or Lost | Rk |
| Nevada | 0.8 | 40 | -5.2 | 3 | 5.9 | 1 |
| Eastern Michigan | 0.5 | 50 | -5.3 | 2 | 5.8 | 2 |
| New Mexico State | -0.2 | 69 | -5.9 | 1 | 5.7 | 3 |
| Miami-OH | 2.1 | 9 | -3.2 | 5 | 5.3 | 4 |
| Utah | 3.4 | 3 | -1.4 | 26 | 4.8 | 5 |
| Middle Tennessee | 0.6 | 44 | -3.3 | 4 | 3.9 | 6 |
| SMU | 0.7 | 41 | -2.9 | 8 | 3.6 | 7 |
| UL-Lafayette | 1.7 | 19 | -1.9 | 18 | 3.6 | 8 |
| Georgia Tech | 0.3 | 55 | -2.8 | 9 | 3.1 | 9 |
| Idaho | 1.6 | 22 | -1.4 | 25 | 2.9 | 10 |
| Buffalo | 0.6 | 45 | -2.3 | 15 | 2.9 | 11 |
| Army | 0.6 | 47 | -2.3 | 14 | 2.9 | 12 |
| Troy | 0.3 | 58 | -2.4 | 11 | 2.7 | 13 |
| Arizona | 1.9 | 10 | -0.7 | 39 | 2.6 | 14 |
| Marshall | 3.4 | 1 | 0.8 | 85 | 2.6 | 15 |
| Connecticut | 1.5 | 23 | -1.1 | 32 | 2.6 | 16 |
| Navy | 1.9 | 11 | -0.7 | 42 | 2.6 | 17 |
| Wyoming | 2.3 | 7 | -0.1 | 60 | 2.5 | 18 |
| UL-Monroe | 1.8 | 17 | -0.7 | 41 | 2.4 | 19 |
| South Carolina | 1.0 | 35 | -1.4 | 23 | 2.4 | 20 |
| Bowling Green | -0.7 | 82 | -3.1 | 6 | 2.4 | 21 |
| Hawaii | 1.9 | 14 | -0.5 | 44 | 2.4 | 22 |
| Arizona State | 0.7 | 42 | -1.6 | 20 | 2.3 | 23 |
| Florida | 2.4 | 5 | 0.1 | 70 | 2.3 | 24 |
| Colorado State | 1.9 | 12 | -0.4 | 47 | 2.3 | 25 |
| UCLA | 1.0 | 36 | -1.2 | 29 | 2.1 | 26 |
| California | -0.5 | 75 | -2.5 | 10 | 2.0 | 27 |
| Kansas | 2.6 | 4 | 0.7 | 81 | 1.9 | 28 |
| Boston College | 3.4 | 2 | 1.6 | 100 | 1.9 | 29 |
| Houston | 0.1 | 63 | -1.7 | 19 | 1.8 | 30 |
| Louisville | 0.3 | 56 | -1.4 | 24 | 1.8 | 31 |
| Georgia State | 1.0 | 34 | -0.7 | 38 | 1.7 | 32 |
| South Florida | -0.7 | 81 | -2.4 | 13 | 1.7 | 33 |
| UNLV | 1.4 | 24 | -0.2 | 57 | 1.6 | 34 |
| Oklahoma | 1.6 | 20 | 0.1 | 67 | 1.5 | 35 |
| Nebraska | 1.1 | 32 | -0.3 | 55 | 1.3 | 36 |
| Auburn | 1.0 | 33 | -0.3 | 50 | 1.3 | 37 |
| Virginia Tech | 1.1 | 31 | -0.2 | 58 | 1.3 | 38 |
| West Virginia | 0.6 | 46 | -0.6 | 43 | 1.2 | 39 |
| Texas | 2.4 | 6 | 1.2 | 97 | 1.1 | 40 |
| Vanderbilt | 1.6 | 21 | 0.5 | 76 | 1.1 | 41 |
| Kent State | 0.0 | 66 | -1.1 | 33 | 1.0 | 42 |
| Utah State | 1.2 | 27 | 0.2 | 71 | 1.0 | 43 |
| Texas Tech | 1.2 | 28 | 0.2 | 72 | 0.9 | 44 |
| UTSA | -0.6 | 80 | -1.5 | 22 | 0.9 | 45 |
| NC State | 0.7 | 43 | -0.2 | 59 | 0.8 | 46 |
| Central Michigan | -1.3 | 98 | -2.1 | 17 | 0.8 | 47 |
| UTEP | -0.1 | 68 | -0.8 | 36 | 0.7 | 48 |
| Iowa State | 1.8 | 16 | 1.2 | 95 | 0.6 | 49 |
| Wake Forest | 1.1 | 30 | 0.5 | 78 | 0.6 | 50 |
| Massachusetts | -1.0 | 92 | -1.6 | 21 | 0.6 | 51 |
| Illinois | -0.7 | 83 | -1.2 | 28 | 0.5 | 52 |
| Oregon | 0.4 | 51 | 0.0 | 64 | 0.5 | 53 |
| Florida Atlantic | 1.2 | 29 | 0.7 | 82 | 0.5 | 54 |
| Michigan State | 0.6 | 48 | 0.1 | 69 | 0.4 | 55 |
| Michigan | 0.9 | 38 | 0.6 | 79 | 0.4 | 56 |
| Syracuse | 1.3 | 26 | 0.9 | 87 | 0.4 | 57 |
| Ohio State | 2.2 | 8 | 2.0 | 110 | 0.3 | 58 |
| Purdue | -0.4 | 73 | -0.7 | 40 | 0.2 | 59 |
| North Carolina | 1.3 | 25 | 1.0 | 92 | 0.2 | 60 |
| Pittsburgh | 1.8 | 15 | 1.6 | 102 | 0.2 | 61 |
| Arkansas | -1.0 | 89 | -1.2 | 30 | 0.2 | 62 |
| Colorado | 1.0 | 37 | 0.8 | 84 | 0.1 | 63 |
| Oklahoma State | 0.1 | 64 | 0.0 | 65 | 0.1 | 64 |
| Stanford | -0.5 | 74 | -0.5 | 45 | 0.0 | 65 |
| South Alabama | -0.3 | 71 | -0.3 | 51 | 0.0 | 66 |
| Fresno State | -1.2 | 96 | -1.0 | 34 | -0.1 | 67 |
| San Jose State | 0.2 | 61 | 0.4 | 75 | -0.2 | 68 |
| Memphis | -1.5 | 102 | -1.3 | 27 | -0.2 | 69 |
| Ole Miss | -2.6 | 119 | -2.4 | 12 | -0.2 | 70 |
| Indiana | 1.9 | 13 | 2.1 | 111 | -0.2 | 71 |
| Florida State | 0.4 | 52 | 0.6 | 80 | -0.2 | 72 |
| Minnesota | -0.6 | 77 | -0.3 | 53 | -0.3 | 73 |
| Louisiana Tech | -2.4 | 115 | -2.1 | 16 | -0.3 | 74 |
| Ball State | -0.7 | 84 | -0.4 | 48 | -0.3 | 75 |
| East Carolina | 1.7 | 18 | 2.2 | 113 | -0.5 | 76 |
| Florida International | -1.6 | 105 | -1.1 | 31 | -0.5 | 77 |
| Rice | 0.2 | 60 | 0.8 | 86 | -0.6 | 78 |
| Washington State | -0.6 | 78 | 0.1 | 68 | -0.7 | 79 |
| Washington | 0.3 | 57 | 1.0 | 91 | -0.7 | 80 |
| Missouri | -1.0 | 90 | -0.3 | 54 | -0.7 | 81 |
| North Texas | -3.8 | 124 | -3.0 | 7 | -0.8 | 82 |
| Duke | -1.0 | 91 | 0.0 | 66 | -1.0 | 83 |
| Central Florida | -2.0 | 110 | -0.9 | 35 | -1.1 | 84 |
| Temple | -1.9 | 108 | -0.8 | 37 | -1.1 | 85 |
| Western Michigan | 0.0 | 65 | 1.1 | 94 | -1.1 | 86 |
| Notre Dame | -1.6 | 104 | -0.3 | 52 | -1.2 | 87 |
| Tulane | -0.1 | 67 | 1.2 | 98 | -1.3 | 88 |
| Texas State | 0.4 | 53 | 1.7 | 106 | -1.3 | 89 |
| Clemson | 0.2 | 62 | 1.6 | 101 | -1.4 | 90 |
| LSU | 0.4 | 54 | 1.8 | 107 | -1.5 | 91 |
| Cincinnati | -0.8 | 87 | 0.8 | 83 | -1.6 | 92 |
| Penn State | -1.7 | 106 | -0.1 | 61 | -1.6 | 93 |
| New Mexico | 0.8 | 39 | 2.7 | 119 | -1.9 | 94 |
| Northern Illinois | -2.0 | 111 | -0.1 | 62 | -1.9 | 95 |
| Kansas State | -2.1 | 113 | -0.2 | 56 | -1.9 | 96 |
| Mississippi State | -1.4 | 100 | 0.5 | 77 | -2.0 | 97 |
| Arkansas State | 0.2 | 59 | 2.3 | 114 | -2.0 | 98 |
| Tulsa | 0.6 | 49 | 2.7 | 118 | -2.1 | 99 |
| Baylor | -0.4 | 72 | 1.7 | 104 | -2.1 | 100 |
| USC | -1.2 | 97 | 1.0 | 90 | -2.2 | 101 |
| TCU | -1.0 | 93 | 1.2 | 96 | -2.3 | 102 |
| Northwestern | -2.0 | 112 | 0.3 | 74 | -2.4 | 103 |
| Iowa | -1.4 | 99 | 0.9 | 88 | -2.4 | 104 |
| Alabama | -2.8 | 120 | -0.4 | 46 | -2.4 | 105 |
| Kentucky | -1.4 | 101 | 1.0 | 89 | -2.4 | 106 |
| Virginia | -0.8 | 88 | 1.6 | 103 | -2.4 | 107 |
| Maryland | -0.8 | 85 | 2.1 | 112 | -2.8 | 108 |
| Akron | -1.1 | 95 | 1.9 | 108 | -3.0 | 109 |
| UAB | -0.8 | 86 | 2.3 | 115 | -3.1 | 110 |
| BYU | -1.9 | 109 | 1.3 | 99 | -3.2 | 111 |
| Boise State | -2.2 | 114 | 1.1 | 93 | -3.3 | 112 |
| San Diego State | -0.6 | 79 | 2.8 | 120 | -3.4 | 113 |
| Miami-FL | -1.5 | 103 | 2.0 | 109 | -3.4 | 114 |
| Wisconsin | -3.8 | 123 | -0.3 | 49 | -3.4 | 115 |
| Georgia | -1.1 | 94 | 2.5 | 117 | -3.6 | 116 |
| Air Force | -0.3 | 70 | 3.3 | 123 | -3.6 | 117 |
| Tennessee | -3.8 | 125 | -0.1 | 63 | -3.7 | 118 |
| Western Kentucky | -3.7 | 122 | 0.2 | 73 | -3.9 | 119 |
| Southern Miss | -0.6 | 76 | 3.6 | 125 | -4.2 | 120 |
| Texas A&M | -3.2 | 121 | 1.7 | 105 | -4.9 | 121 |
| Rutgers | -2.5 | 117 | 2.4 | 116 | -4.9 | 122 |
| Toledo | -2.4 | 116 | 2.8 | 121 | -5.2 | 123 |
| Ohio | -1.8 | 107 | 3.4 | 124 | -5.2 | 124 |
| Oregon State | -2.5 | 118 | 3.3 | 122 | -5.8 | 125 |
As time goes on, we will begin to figure out how much of this difference is luck and randomness and how much was caused by other factors that we aren't including here. But I found it interesting. We see some pretty big teams on the unlucky end of the list -- Oregon State, Rutgers, Texas A&M, Tennessee, Georgia, Wisconsin, Miami, Boise State, BYU -- and if there's something to this, those teams might see a bit of a natural bounce back in 2014. Meanwhile ... apparently Eastern Michigan was lucky to only be as bad as it actually was? A frightening thought. We'll see.
But there might not be anything to this. Keep that in mind. This is the brainstorming portion of the program.
So where are we?
So we've gone through four of the five factors, and here's where we are so far:
- Efficiency: Success Rate (100%)
- Explosiveness: IsoPPP (100%)
- Field Position: Turnover Margin (21%), Success Rate (37% -- 18.5% each for offense and defense), Kickoffs Margin (22%), Punt Margin (22%).
- Finishing Drives: IsoPPP (38.5% -- 21.5% defense, 17% offense), Red Zone Success Rate (33.5% -- 18% offense, 15.5% defense), Success Rate (23% -- 12% offense, 11% defense), FG efficiency (5% -- 3% offense, 2% opponents).
- Turnovers: ?
In all, we've talked about seven different "factors" so far, not five: Success Rate, IsoPPP, Turnovers, Kickoffs, Punts, Red Zone Success Rate, and Field Goals. (Well, six, really, since Turnovers are another part of the conversation to come, too.) It's messy, but we're getting an idea for the weight and importance of each of these factors, and that's exciting. On to Turnovers...
Loading comments...