-format(webp)/cdn.vox-cdn.com/uploads/chorus_image/image/43658230/RecoveryRate1.0.jpg)
First things first: have you been reading Varsity Numbers this year? I still write a weekly piece at Football Outsiders each Friday afternoon, using it mostly for whatever statty ideas I haven't had a chance to explore over the first 4.5 days of the week.
Earlier this season, I took a look at something that ties to turnovers luck, the Five Factors, etc..
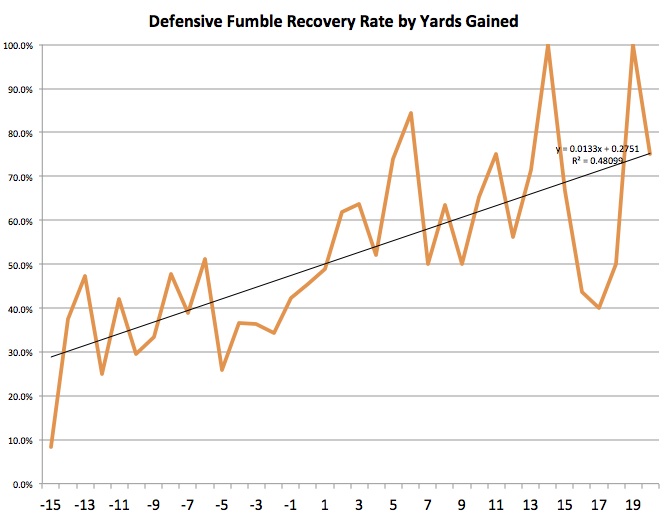
If you exclude sacks and look only at intentional runs (and catches), you see pretty clearly that if a fumble happens in the backfield, where defenders are less likely to be hanging around en masse, offenses recover the ball nearly two-thirds of the time. Meanwhile, if the fumble happens more than 10 yards downfield, where blockers and stray teammates are less likely to be hovering, defenders recover the ball nearly two-thirds of the time. In all, the recovery rates correlate pretty strongly overall with where the fumble occurs.
I basically pocketed that idea to pursue in more detail in the offseason.
In today's VN, I went further down the Five Factors road.
Below is a table with quite a few measures, all either unadjusted for opponent or culled from other sources, i.e., Brian Fremeau's special teams ratings. (I have my own ideas for determining special teams efficiency, explored a bit here, but I haven't fleshed them out yet, and besides, Brian's numbers are good.) Here's a list, along with the "Factors" associated with them.
Success Rate Margin (offensive success rate minus defensive success rate) -- efficiency, field position, finishing drives, perhaps turnovers (because turnovers are more likely to come from passing downs, and efficiency helps you to avoid passing downs).
IsoPPP Margin -- explosiveness, field position. This is described here. Essentially, it is a measure of the magnitude of only a team's successful plays. This isolates efficiency from explosiveness by looking only at what happens once you've been efficient.
Red zone Success Rate Margin -- finishing drives. In its current state, this causes a bit of overlap, since the overall success rate figures above also include red zone plays. Once the offseason comes, I will look at isolating the two, but we'll go with this for now.
Five FEI special teams stats (Kick Efficiency, Kick Return Efficiency, Punt Efficiency, Punt Return Efficiency, Field Goal Efficiency) -- field position (for the first four), finishing drives (for FGE). Special teams play a small but undeniable role in a game's outcome, and aside from how it impacts the drive component of S&P+, it doesn't play much of a role in S&P+. It will in the future iteration.
Sack Rate Margin -- turnovers. So here's where things get messy. Turnovers are a mix of skill, randomness, and luck, and unpacking the former one from the latter two is quite hard. I have played with INT-to-PBU rates, standard downs-to-passing downs ratios, etc, but of the primary stats at our disposal, the only thing directly connected to turnovers is sacks. Sacks lead to forced fumbles at a higher rate than the normal play, plus I figure there's the indirect effect of telling you how harried a passer is from how often he's getting brought to the ground. A harried passer is a more pick-prone passer, right? I didn't expect this to play a role, but it might play a pretty strong one.
Expected Turnover Margin and Turnovers Luck -- turnovers. This looks at the number of fumbles, interceptions, and passes broken up in a given game (for both offenses) and uses national averages to assign probabilities. Normally, interceptions make up between 21 and 23 percent of total passes defensed at the college level. (So far in 2014, it's around 21 percent.) Meanwhile, offenses tend to recover about 51 to 53 percent of fumbles, though there's a way to dial in a bit more specifically there. Based on general averages, you can determine about how many turnovers a team should have had, then compare it to how many they did have, which is where Turnovers Luck comes into play. Turnovers Luck, for these purposes, is basically the difference between projected and actual TO margin. [...]
I got to a 0.930 correlation (87 percent) with the following combination of factors:
* 33 percent success rate
* 23 percent IsoPPP
* 11 percent turnovers luck
* 8 percent red zone efficiency
* 6 percent sack margin
* 6 percent kickoff efficiency
* 5 percent field goal efficiency
* 4 percent expected turnover margin
* 2 percent kick return efficiency
* 2 percent punt efficiency
* 1 percent punt return efficiency.
There's a lot more in the post, but the gist is that, using the above factors, I can explain close to 90% of a team's percentage of points scored. It's overfitting, and it's completely unadjusted for schedule, but I wanted to see what would happen.
Assuming it actually results in an improvement in terms of predictiveness, etc., this is in some degree where S&P+ is headed. It's still a big mess, but this is where Five Factors seems to be taking me (among other things, it's taking me to far more than Five Factors, but I kind of knew that). Feedback welcome.
Loading comments...