-format(webp)/cdn.vox-cdn.com/uploads/chorus_image/image/27142513/20121201_ajw_sa2_075.0.jpg)
Ever wondered how the 2005 Big Ten would stack up against the 2013 SEC? Now you can find out.
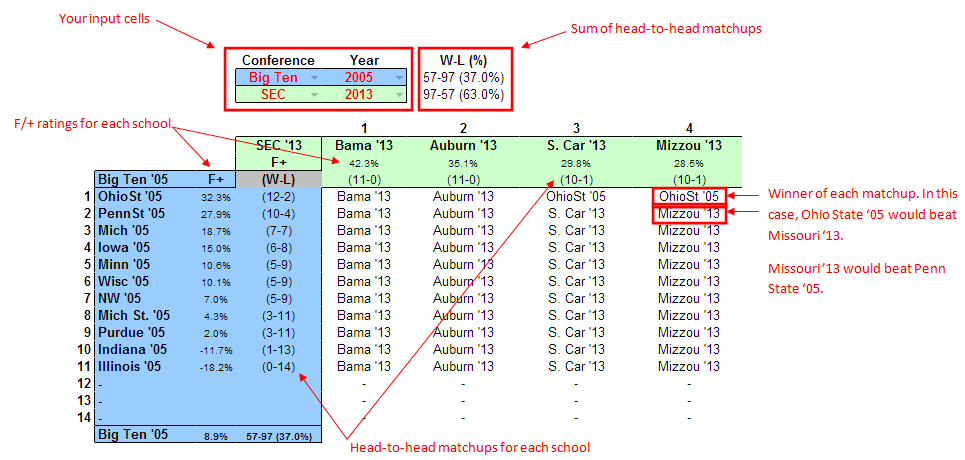
I used the F/+ rankings for every team between 2005 - current to build the Google spreadsheet listed below. All you need to do is enter the conferences you want to look at in cells D3 and D4. Then enter the seasons you want to look at in cells E3 and E4. That's it. The spreadsheet lists all of the teams from both conferences along with their F/+ ratings.
The results tell you how each team would do in a head-to-head matchup with the teams from the other conference. In this case, 2005 Ohio State would go 12-2 against the 2013 SEC, losing to Bama and Auburn. 2013 Ole Miss would go 8-3 against the 2005 Big Ten, losing to Ohio State, Penn State, and Michigan.
Here's a quick guide to the results (click on this to make it larger):
In reality, it's easier just to monkey around with the spreadsheet and figure it out that way. Hopefully this makes makes once you get in there.
The last time I created a Google spreadsheet for you to use, we had an issue with too many users trying to make changes to it at the same time. To deal with that, I created 4 mirror spreadsheets. If someone else is using the one you click on, either wait for them to finish or pick another mirror link.
One last thing: a lot of work went into this thing. I spot-checked it for bugs, but I can't guarantee that everything is perfect. If you see something that looks out of whack, please let me know in the comments and I'll do my best to correct it on the fly.
@okc_dave
LINKS TO SPREADSHEETS:
Loading comments...