-format(webp)/cdn.vox-cdn.com/uploads/chorus_image/image/15196209/153590202.0.jpg)
In my most recent article, I took a look at drive outcome frequencies in college football. What I wanted to do next was take a look at how your current drive affected your opponent's next drive. In order to do this, I had to first look at a team's average spot following a kickoff. This turned out to be much more complicated than I was expecting. In addition, the new rule change in 2012 made it so any analysis I perform on the years 2005-11 won't quite carry over to 2012. So what was the actual effect of the kickoff rule change in 2012? Let's find out.
The Rule
This quote is taken from an NCAA article on the midseason results of the new kickoff rule change:
This season, kickoffs are from the 35-yard line instead of the 30-yard line. If the kick results in a touchback, the offense starts its possession at the 25-yard line instead of the 20-yard line.
Additionally, kicking-team players are allowed only a five-yard running start before the ball is put into play. Previously, players were allowed to take as long of a running start as they wanted.
The Data
Thanks again to cfbstats.com for providing a whole bunch of data on college football. My summer would be so much less fun without their help (and yes, I consider producing charts and graphs about college football "fun", the reasons behind me being a Georgia Tech student are starting to make more sense).
This paragraph details how I compiled the kickoff data. If you don't care then just skip ahead to the analysis. At first I figured I could just look at the drive data, which contains information on both the Start Spot of a drive and a Start Reason for a drive. Just average the Start Spot when the Start Reason was a kickoff, right? Well, if a kickoff is returned for a touchdown it isn't listed as a "drive". So inevitably I would be overestimating the true average start spot. So I had to take a different route. Luckily in the data there is information on all kickoffs that occur and all kickoff returns that occur. Now I just had to go about matching the kickoff data to the play-by-play data, so I made sure to not miss any kickoffs. This was all done in R (for the other nerds I was able to not use python at all in messing with the data, big accomplishment for me to fully transition to R), and if you have any questions on how I did anything feel free to ask in the comments or shoot me an email. So now that I have information on all kickoffs and kickoff returns for 2010, 2011, and 2012, we can start to look at the subtle changes that were caused by the rule change.
The Analysis
The immediate and probably largest change from the new rules was that touchbacks would be much more prevalent. If you move the kicker up five yards, he is gonna boot it in the endzone much more often. But just how often?
| Year | Pre-Rule Change (2010-2011) |
Post-Rule Change (2012) |
| Touchback % | 15.2% | 34.8% |
That is a pretty stark difference. I used two years of data for Pre-Rule Change and only one year of data for post rule change, but I think the touchback % would be pretty consistent for future years as well. Actually, I think that the touchback % will go down in future years. The change in the spot of the kickoff means that teams could start rainbow kicking the ball just short of the endzone and forcing teams to return the ball. Because touchbacks are now brought out to the 25 instead of the 20, teams could be rewarded by giving their coverage units another second or so to get down in coverage and make up for only being allowed a five-yard head start. But anyway, that is for a future post.
We know that the new rules produced a much higher percentage of touchbacks than before, but were the actual returns themselves affected? Here is a density plot from my favorite plot package in R, ggplot2, that shows the differences in the frequencies of the return yards.
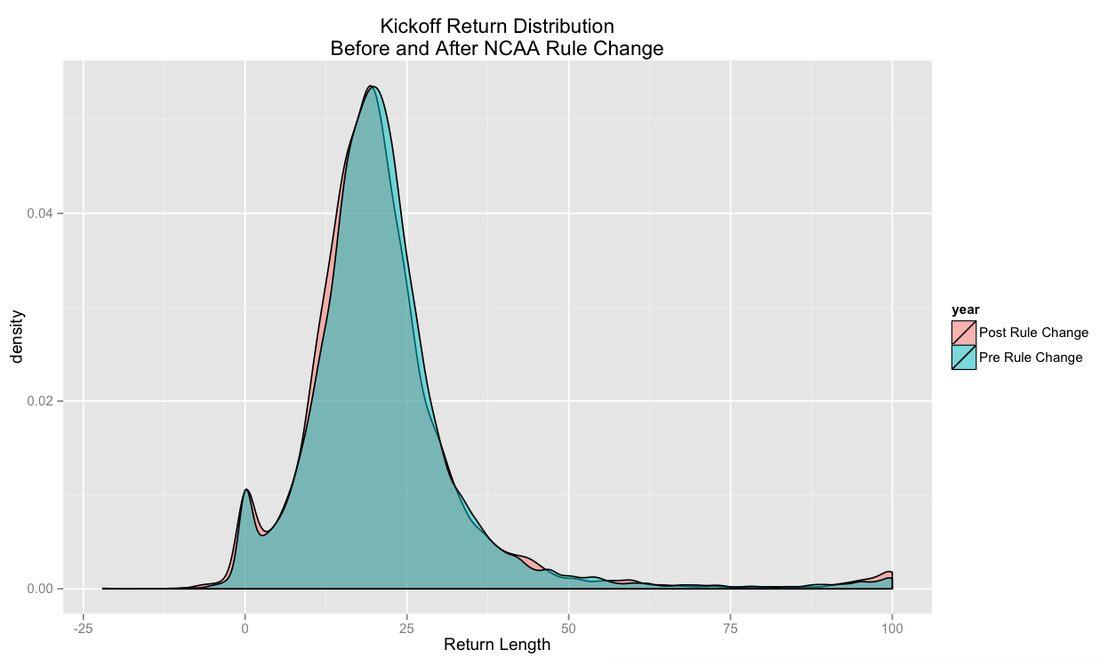
The green is the overlap between the two subsets, the orange sliver on the left of the hump is from 2012, and the teal sliver on the right is from before the rule change. In addition these are the returns that happened on non-touchbacks, non-onsides, non-out of bounds, and non-fair catches. The average return from before the rule change was 21.4 yards and the average return after it was 21.1 yards. The subtle changes in the frequencies and the average make it seem to me that there was a real shift in return distance, however small. I think that the fact that the difference is so small is partially due to selection bias from the kickoff returners. In the old days (a.k.a. two seasons ago), if a returner fielded a kickoff in the endzone he would probably take it out if he wasn't too far back. But now with the new rule change a kickoff returner is much smarter to simply take the touchback and get the ball at the 25. This should cut down on some bad decisions to return the ball so the returns that are being tracked in 2012 for return distance are "better" returns than the returns from before the rule change.
So what else might change with the returns? Well how are touchdowns affected? Here is the touchdown rate for kickoff returns, before and after the rule change.
| Year | Pre Rule Change | Post Rule Change |
| Touchdown % | 1.0% | 1.3% |
I hope that the increase in touchdown %, however small, is a result of the selection bias I was talking about earlier. The returns that are being taken out of the endzone now probably have more potential than the average return taken out of the endzone before the rule change. Or it could be just a fluke.
Conclusions
So what does this all mean for the change in the starting spot for drives following a kickoff? Here is a plot of the frequency for the starting spot before and after the rule change, with the red line as the average start spot 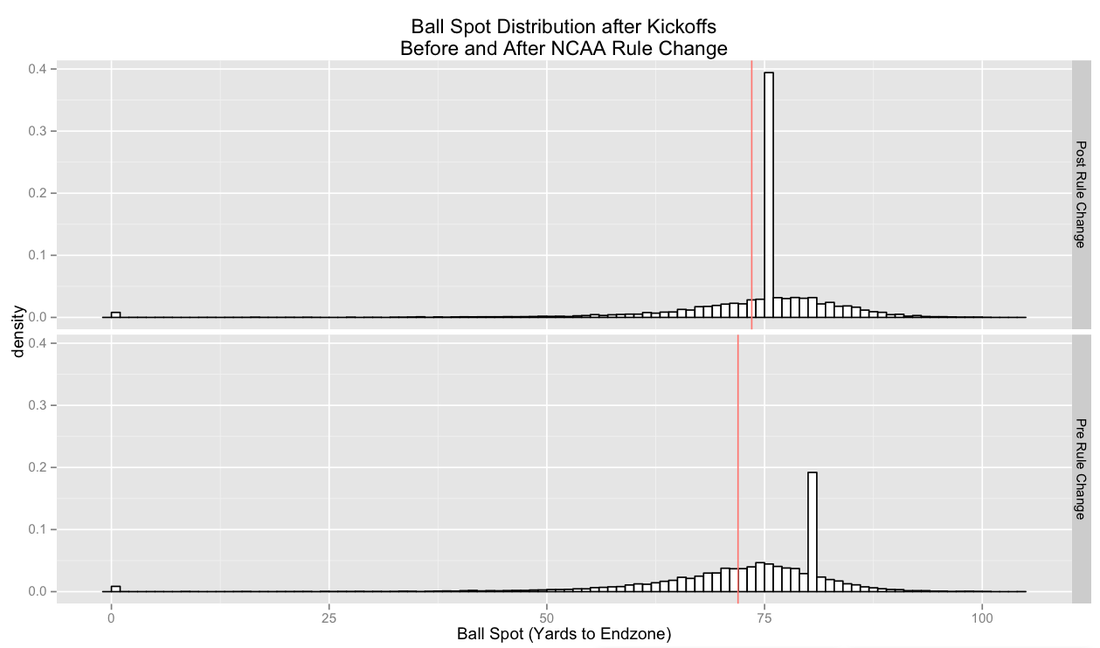
The main effect of the rule change is definitely the touchback frequency, the spike at your own 25 yard line is huge. But other than that, there have only been small shifts in kickoff returns. In total the new kickoff rule changes moved the receiving team back by about an extra yard and a half per drive on average. Teams used to start the drive with about 72 yards to go, and teams now start their drives with 73.5 yards to go, on average. We actually could have calculated this without using any data on returns whatsoever. If we assume that 35% of kickoffs in 2012 were going to get the 5 yard boost from the new touchback spot, our average start spot would increase, in favor of the offense, by 1.75 yards (.35*5). If we assume that the other kickoffs that were returned had a 5 yard penalty from the new kickoff spot, that would hurt the offense by 3.25 yards (.65*5). Adding these together and we get a difference of 1.5 yards in favor of the kicking team, and this is exactly what we see empirically. The change, or lack there of, in return length had no affect on the average start spot of a drive. It was entirely driven by the change in kickoff spot and touchback spot. What do you guys think? Any other changes that might have occurred that I missed? Put them in the comments.
** Author's note: I had the numbers backwards in the last paragraph, thans to CarrotTop4 for pointing that out. They are now fixed **