-format(webp)/cdn.vox-cdn.com/uploads/chorus_image/image/12810851/152045648.0.jpg)
Third downs are an integral part to any college football game. They can tell you if an offense can extend drives, and can tell you how much an offense puts itself into holes. But not all third downs are created equally. I am a Georgia Tech student and fan, and I am always frustrated when a silly mistake on first or second down puts us in a huge hole on third and long and our option offense loses much of its value. So I wanted to know, can we getter a better sense of how a team performed on third down by looking at the different third downs that a team faced throughout the season? I hope to present a series of articles that dives in to this questions and develops a better metric for measuring third downs. Lets get started.
The Data:
Thanks to College Football Stats we have play-by-play data from 2005-2012. I downloaded the data from the past five seasons, 2008-12, to get a data set big enough to look at the total number of third downs for each team. From there the coding fun began. I used Python to organize and compile the exact data I wanted, and if anyone wants to review the actual code I used then feel free to message me or put down a comment. If you don't care about the nitty gritty then feel free to skip the next paragraph, I promise I won't be offended.
From the master play-by-play file I had to restrict the data to what I wanted. First up I wanted to remove any games that didn't feature two FBS teams, no cupcakes in this study. Now that I had the games I wanted, I had to go about finding the third downs and determining if they were successful or not. I looked at each play in the whole data set; if that play was a third down I had to see if the next play was a fourth down or turnover (failure) or if the next play was a first down or touchdown (success). I also made sure it was still the same game and the same drive so no end of half or end of game plays were counted. In addition if there was a penalty on third down I did not count the play as an attempt. This method could have missed some weird third down attempts where a team punted, kicked a field goal, or took a safety, but that's not really what I am looking for either, so I think we are okay to go from here. Now I had a complete list of each third down a team encountered, and whether or not they were successful at converting that third down. Once I had the complete list I also restricted the data set to only the third downs that occurred when one team was within 14 points of the other to create a data set of only non garbage time plays. I am unsure if this will have a measurable effect or not, and also am not sure what cutoff to use. Some discussion in the comments would be greatly appreciated.
So what does a list of total third downs that each team faced get me? Two things. First, I can now calculate an expected third down percentage for each distance a team will encounter. Second, I can get an expected third down value for each team. To get the average third down conversion % for each distance I grouped the total list of third downs I had by the distance to go. For instance, there were a total of 1,309 third-and-10 attempts by this method, and teams converted 373 of them (28.5%). I did this for third-and-1, third-and-2, and so on up all the way to third-and-50, although anything after third-and-20 was was a crapshoot. So now I knew exactly how many times an average team facing an average defense would be expected to convert a third down based on the distance to a 1st down. The following chart presents the values for each year from 2008-2012.
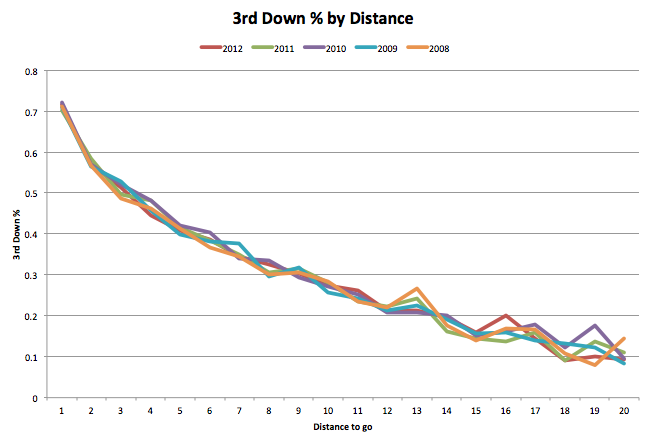
There doesn't appear to be a noticeable trend in any recent years, so I will be using the average of the last five years for the expected third down percentage by distance to go.
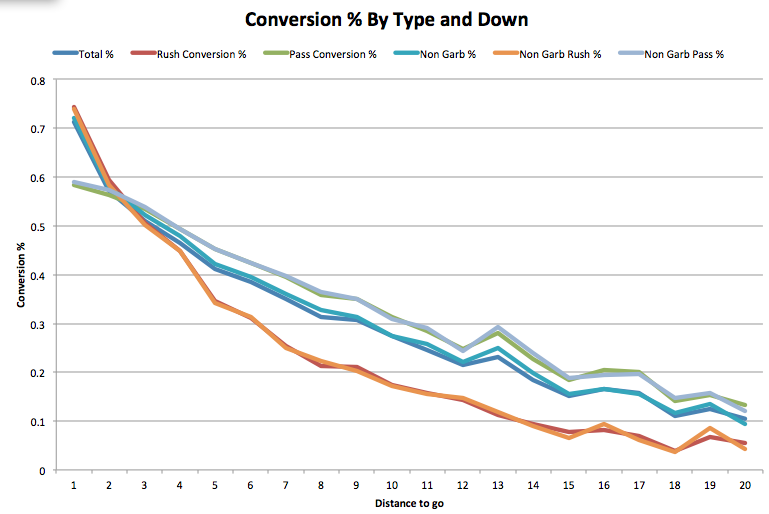
I also have the conversion rate based off whether or not the team ran or passed the ball, although I am unsure how much value we can gain from those numbers. So what do those numbers look like? Here is a graph depicting the 3rd down success rate by distance and by play type:
And here are google doc links to the raw data for total third downs by distance for each team in 2012, and the final conversion numbers that the chart pulls from for all seasons since 2008.
Conclusions:
The graph tells us a couple of things.
First, the removal of garbage time plays raised the expected third down % across the board. Not by much, but it is clear that removing those plays changes the percentages.
Second, teams convert third downs at a much higher rate if they pass the ball, for each distance greater than two. I think, and I may be wrong, that game theory says that the pass conversion % and rush conversion % should be equal over the long run. If teams are converting passing plays at a higher rate, then defenses should adjust and start covering the pass more on third downs, which in turn will open up the run; then, teams will start converting running plays more often. It seems that there is some inefficiency going on, and offensive coordinators would be smart to pass the ball more often than average on third downs to take advantage of it.
And finally, what is going on at third-and-13? The expected conversion rate decreases at each value of distance to go except at 13 yards to go and then at 15 to go. I have no idea why this is happening, any ideas?
In my next article I will look at what we can learn about the run-pass ratios at each distance, or developing a new third down metric. I hope the data can lead the way. If you have any questions or suggestions then please comment. The football analytics movement can't get going without discussion. And thanks again to cfbstats.com; this would not be possible without them.
EDIT: My new friend PeterinVA reminded me that I totally forgot that the NCAA recorded sacks as rushing plays (does anyone know why they do this??) so when I separated the 3rd downs into passing and rushing plays, I really separated them into "Attempted passes" and "rushing plays plus sucks" so naturally the rush % is so low and passing % is so high, the pass % ignores a lot of negative plays. So ignore the rush and pass %'s for now, a fix will be coming soon though. Hopefully.
Loading comments...