"The worst BCS Bowl team ever?" was the question Rachel Bachman of the Wall Street Journal asked, well, no one in particular last December when Northern Illinois found themselves in the Orange Bowl in a matchup against Florida State. While their performance in that game (a 31-10 loss) doesn’t give me much to work with, I will briefly take on the role as their public defender today.
No, Northern Illinois was not the worst BCS Bowl team ever. And here’s why: NIU’s F/+ rating was +11.9% while 2011 Fiesta Bowl participant UCONN’s F/+ rating was -1.4%. This means that NIU was 11.9% better than the average team and UCONN was 1.4% worse than the average team. I rest my case.
If only it were that easy. If you were in a jury box and I threw those numbers at you, you’d pretend like you were taking notes while you secretly gazed out the window thinking about the season finale of The Walking Dead.
I love F/+ ratings, and I really appreciate the work that goes into them, but I have to admit that sometimes I don’t really know how to use them. My goal with this post will be to make these figures a little easier to digest using some visuals.
Here’s my method. Going back through the 2007 season, I took every FBS team’s offensive and defensive F/+ ratings and plotted them on the chart below, so each blue dot represents a single team. This is a group of 723 teams over a 6-year period (go ahead, count the dots). The key points to remember in this post:
- The better a team’s offense is, the further "north" they are on the chart.
- The better a team’s defense is, the further "east" you want to be.
- The best teams reside in the NE corner.
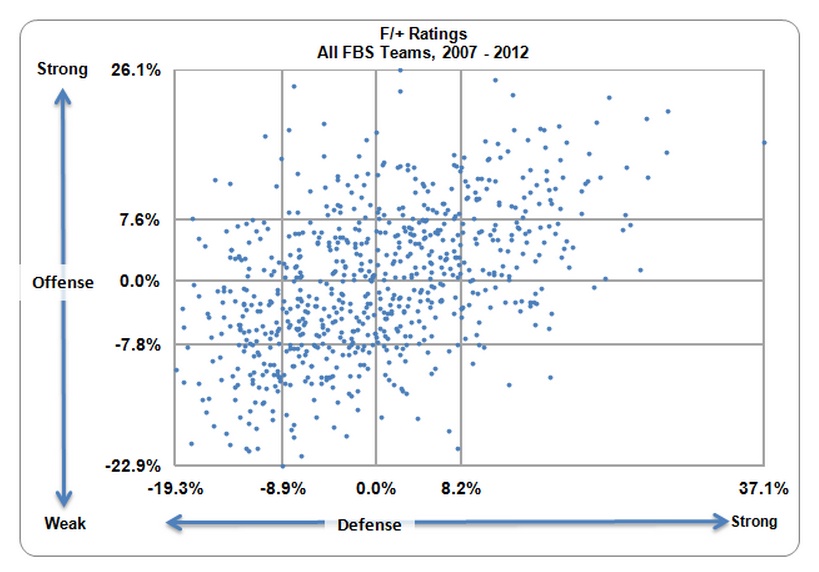
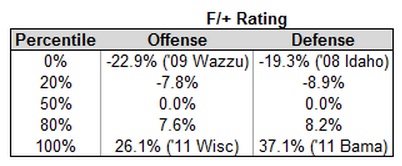
What are those lines in the middle of the chart, you ask? I thought it would be helpful to divide the data up into useful groups, so I for both offense and defense I found the minimum, 20th percentile, median, 80th percentile, and maximum:
Now, the scatter plot above doesn’t really tell you much by itself. But with the data behind it, we can do some wonderful things. Here’s one quick example. Let’s single out any team that played in a BCS bowl game over this time period (a group of 60 teams). These teams are represented by orange dots in the chart below:
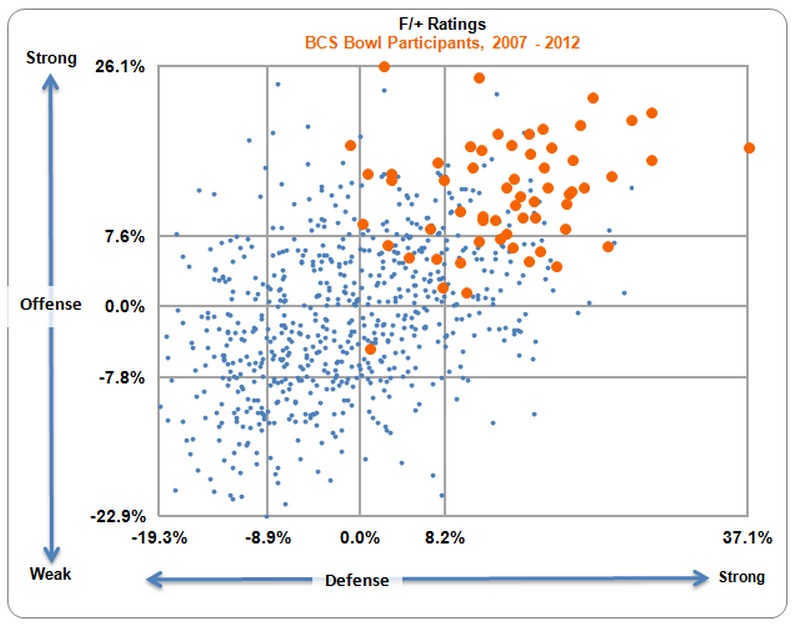
No surprise here, but most of them are in the extreme northeast square, meaning that both their offense and defense are in the 80th percentile or better.
Only 9% of the entire group of 723 teams in this six-year period are in this "elite" northeast square.
62% of BCS bowl game participants are in that square.
All six of the BCS title winners in this time period are in that square.
58 out of the 60 BCS bowl game participants are in the northeast quadrant, meaning that their offense and defense have a percentile rating of 50% or above. More on that in a bit.
What about those six title winners? Do they stand out from the rest? Judge for yourself. BCS title winners are in green:
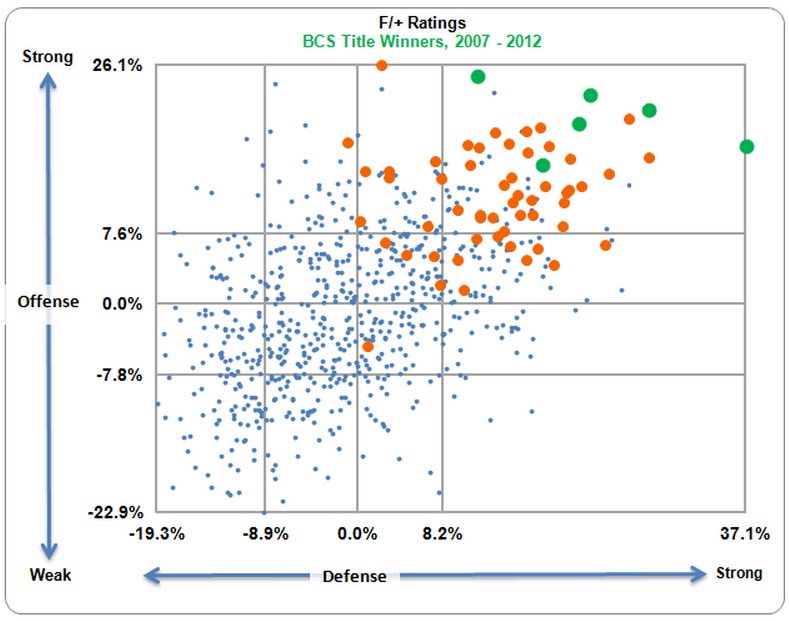
This pretty clearly shows that you need to be truly elite to win the BCS title -- the F/+ ratings say these teams truly are the best of the best. There are plenty of orange dots surrounding the green ones, signifying BCS bowl teams that did not win the title, so being up in the extreme northeast corner doesn’t assure you of winning the big game -- but in order to win it, you need to be really special on both sides of the ball.
Okay, back to the task at hand. Ladies and gentlemen of the jury, I submit to you that Northern Illinois was not the worst BCS bowl team ever. Not even close. While they were not an elite team (F/+: +4.6% defense, +5.3% offense), they are nowhere even close to the worst team. I present Exhibit A, that orange dot at +0.8% defense and -4.6% offense (negative!). This rogue dot that looks like a lost elementary school student separated from his class field trip at the zoo represents your 2010 UCONN Huskies. They went 8-5 (5-2 in conference play) and were embarrassed 48-20 by Oklahoma in the Fiesta Bowl.
Earlier I mentioned that only 2 teams out of the group of 60 BCS bowl game participants are outside of the northeast quadrant. Those two teams are 2010 UCONN and 2009 Cincinnati, who had a really nice offense (+17.6%) but a below average defense (-1.0%). UCONN wasn’t elite, or even really good, on either side of the ball.
Now, I rest my case. And I agree, the season finale of The Walking Dead was pretty weak.
I look forward to bringing you more with this type of analysis soon, including a series on each major conference.
Loading comments...