-format(webp)/cdn.vox-cdn.com/uploads/chorus_image/image/8850047/20130224_jel_ss1_020.0.jpg)
So when we began the Charting Project, one of the things I was most excited about was the data regarding the distance of passes. Since so many passes are basically extended handoffs, counting them the same as a deep ball when it comes to completion percentage just seems odd, especially considering how much we lean on completion percentage as a valid measure.
One of the things Stats, LLC, looks at with its charting data is the idea of a "real completion percentage," basically a look at how a quarterback would have done throwing the same passes as everybody else. They have more charting data than we do, but I thought it would be interesting to look into the same idea with our data.
Below, we'll look at some pretty detailed data about pass distance for the 43 quarterbacks for whom we charted at least 50 passes. It would be pretty nice to have full information about all of the upcoming draft quarterbacks, but ... next year. Here is the list of quarterbacks in this sample: David Ash (Texas), Matt Barkley (USC), Tajh Boyd (Clemson), Trevone Boykin (TCU), Tyler Bray (Tennessee), Teddy Bridgewater (Louisville), Kolton Browning (UL-Monroe), Derek Carr (Fresno State), Rakeem Cato (Marshall), Clint Chelf (Oklahoma State), Seth Doege (Texas Tech), Jeff Driskel (Florida), Cody Fajardo (Nevada), Nick Florence (Baylor), Kiehl Frazier (Auburn), Everett Golson (Notre Dame), Connor Halliday (Washington State), Kevin Hogan (Stanford), Brett Hundley (UCLA), Landry Jones (Oklahoma), Collin Klein (Kansas State), E.J. Manuel (Florida State), Sean Mannion (Oregon State), Johnny Manziel (Texas A&M), Marcus Mariota (Oregon), Taylor Martinez (Nebraska), Andrew Maxwell (Michigan State), A.J. McCarron (Alabama), Zach Mettenberger (LSU), Braxton Miller (Ohio State), Stephen Morris (Miami), Aaron Murray (Georgia), Ryan Nassib (Syracuse), Josh Nunes (Stanford), Keith Price (Washington), Tyler Russell (Mississippi State), Matt Scott (Arizona), Conner Shaw (South Carolina), Geno Smith (West Virginia), Dylan Thompson (South Carolina), Jeff Tuel (Washington State), Bo Wallace (Ole Miss), and Max Wittek (USC).
And of course, before we move any further, a perpetual disclaimer: The data below comes only from the games we charted. For some teams -- the Alabamas and LSUs of the world -- we charted almost every game. For others, it was minimal (to see how many games we charted for each team, go here). That, and not everybody has the same receiving corps. Obviously. In this case, the data below should be used more for conversation than bold, concrete conclusions.
(Actually, in most cases that is how it should be.)
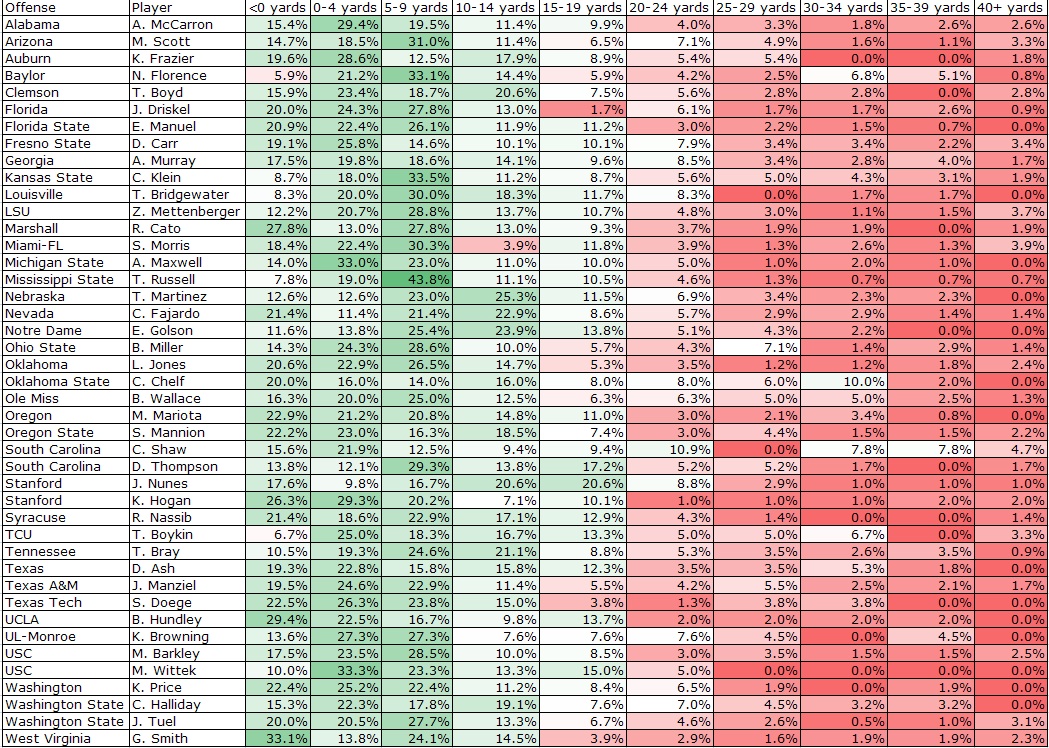
First things first: Who's throwing what kind of passes? Below is a table that shows us the frequency with which each quarterback threw passes with distances of five-yard increments (click on it to enlarge). In other words, it's the percentage of time you threw a pass behind the line of scrimmage, 0-4 yards from the line of scrimmage, et cetera. As one would expect, West Virginia's Geno Smith threw a ton of passes behind the line while others were more based on downfield passing.
Pass Distribution
Some thoughts:
- I guess Baylor doesn't believe in moving backwards. Despite the reputation of the spread, Nick Florence threw just six percent of his passes behind the line of scrimmage, lower than even A.J. McCarron, Zach Mettenberger or other "pro-style" quarterbacks.
- Meanwhile, Geno Smith lived up to his reputation. A full third of his passes targeted somebody behind the line of scrimmage. Nobody else could touch that number.
- Nobody threw deep more frequently in this sample than South Carolina's Connor Shaw. Though as we'll see below, throwing deep isn't quite the same as successfully throwing deep.
- Perhaps the most interesting note comes with the two Stanford quarterbacks. Josh Nunes was incredibly aggressive, throwing 56 percent of his passes at least 10 yards downfield. Meanwhile, Kevin Hogan, who replaced Nunes later in the season (and was quite successful) primarily went short, throwing fewer than 10 yards on 76 percent of his passes. Meanwhile, USC's Matt Barkley and Max Wittek threw mostly similar lengths.
So this tells us a little bit about the personality of different teams' passing games. West Virginia's Air Raid throws 71 percent of its passes within 10 yards of the line of scrimmage, while Washington State's throws about 62 percent that distance. The Clemson spread looks downfield a bit more (34 percent of Tajh Boyd's passes were between 10 and 24 yards downfield), while Baylor loves the 5-9 yard routes. With Conner Shaw in the game, South Carolina goes either very short or very long; with Dylan Thompson, there's a lot more intermediate passing. Now let's look at who's actually completing the passes they are throwing.
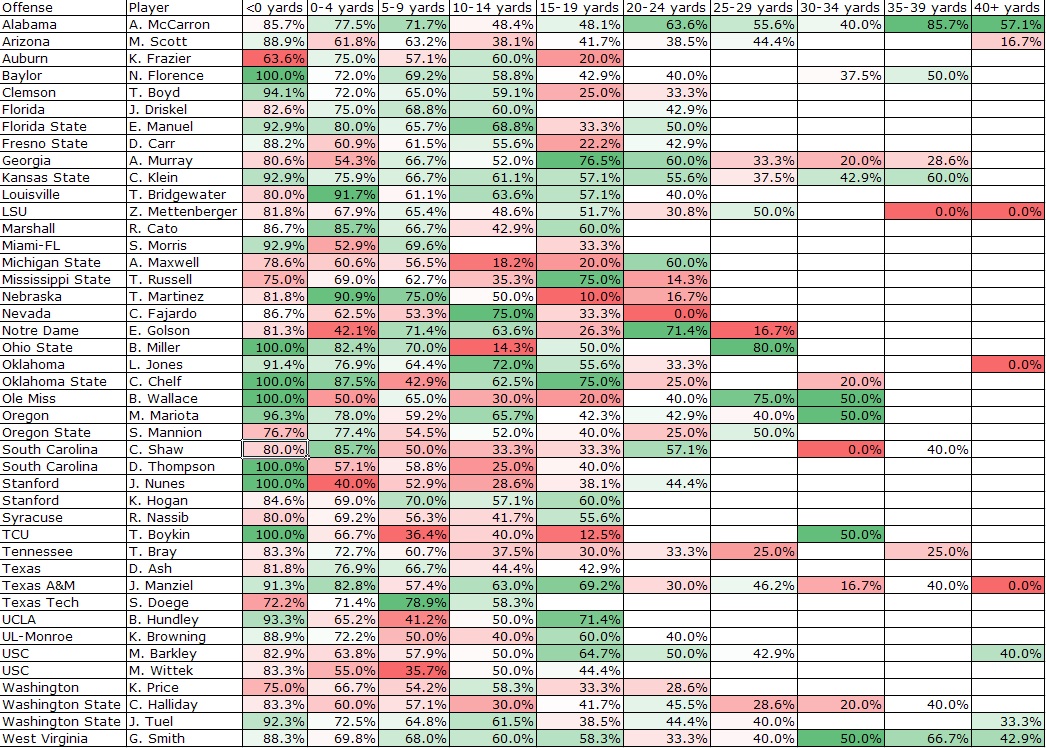
Here's a look at these quarterbacks' completion rates for passes of certain distances. The color code is this: for each yardage range (<0 yards, 0-4 yards, etc.), the numbers in green are on the higher end, and the numbers in red are on the lower end. So basically, if a quarterback's percentages are mostly green, that means he is mostly above the norm in his completion rates for certain distances. Red, then, means the opposite. (The blank spaces mean we charted fewer than three passes, if any, of that length for the given passer.)
Completion Rates For Different Pass Distances
Some more thoughts:
- Matt Barkley's completion percentage was worse than average on all throws fewer than 15 yards downfield. Meanwhile, Collin Klein's completion percentage was better than average for all passes under 25 yards. I'm going to guess you didn't see that coming. That doesn't mean that Klein should potentially be a first-round (or even Top 10) pick instead of Matt Barkley ... but it further reaffirms that Barkley probably shouldn't be sniffing the first round.
What's that?Text I received from a scout this morning: Matt Barkley will not get past the Arizona #Cardinals at No. 7 overall.
— Matt Miller (@nfldraftscout) February 24, 2025 - The biggest doubt I've read about Geno Smith is in regard to his arm strength. This data kind of brings to the table both confirmation and doubt about that. Smith throws a gorgeous deep ball, and as we see here, he was pretty good at completing them. (Yes, he had help from a pair of awesome receivers.) But he was mediocre to poor on the intermediate passes (20-29 yards, basically), the ones a scout will tell you require the most zip.
- Zach Mettenberger didn't get an excessive amount of help from his receiving corps in 2012, but ... this data reaffirms that his performance against Alabama was most certainly not the norm.
- My goodness, look at A.J. McCarron's performance on passes of 20+ yards. Again, like Smith, he got help from Amari Cooper and company. But still.
- Johnny Manziel's percentages are interesting. He was as good as anybody on the super-short passes (<5 yards), decent from 5-14 yards, great from 15-19 yards and pretty spotty on anything deeper.
- Josh Nunes ... did not maximize his percentages. Nor did Matt Scott, really.
- I thought Tyler Bray would come off looking much better than this. Part of this is because he throws a lot of balls away, and part is because two of the Tennessee games we charted were against Alabama and Florida, perhaps the two best defenses in the country. So the sample is unfair to him. But his numbers are really unimpressive. Adjusting for opponent, they would still probably only be neutral, not good.
- Ryan Nassib wowed me when I saw him play at Missouri. His command of the offense and his defense recognition were outstanding. But the data above makes me think Mike Tanier might be correct in his doubts of Nassib.
- Evidently Bo Wallace should only throw bubble screens and balls 20 yards downfield. And Aaron Murray should only throw between five and 25 yards. And Taylor Martinez should never throw a pass further than nine yards.
- E.J. Manuel was almost never asked to throw too far downfield (which is kind of baffling when you consider how many good, fast receivers Florida State had last year). That leaves us with an incomplete picture of him, though he was certainly accurate from 15 yards in. To an extent, it's the same story with Landry Jones. Jones was solid on the short and intermediate stuff, and while he didn't throw many downfield, he didn't complete any either.
So basically, we might be severely underrating A.J. McCarron and Collin Klein, slightly underrating E.J. Manuel and overrating Tyler Bray, Matt Barkley and Ryan Nassib.
Alright, so what if all of these quarterbacks threw the same percentage of passes to different lengths? With the charting data at hand, we can come up with our own approximation of Stats, LLC's Real Completion Percentage. For fun, I'll call it a QB's Adjusted Completion Percentage. You know, to be different.
Below are the adjusted completion percentages for quarterbacks passes at the following rates: 17.8 percent <0 yards, 21.4 percent 0-4 yards, 24.3 percent 5-9 yards, 14.0 percent 10-14 yards, 8.9 percent 15-19 yards, 4.9 percent 20-24 yards, 3.1 percent 25-29 yards, 2.3 percent 30-34 yards, 1.8 percent 35-39 yards, and 1.6 percent 40+ yards.
| Player | Offense |
Adjusted
Comp%
|
| Teddy Bridgewater | Louisville | 70.2% |
| Clint Chelf | Oklahoma State | 70.0% |
| Rakeem Cato | Marshall | 69.7% |
| Collin Klein | Kansas State | 69.0% |
| E.J. Manuel | Florida State | 68.5% |
| A.J. McCarron | Alabama | 68.5% |
| Nick Florence | Baylor | 68.4% |
| Marcus Mariota | Oregon | 67.6% |
| Johnny Manziel | Texas A&M | 66.8% |
| Geno Smith | West Virginia | 66.6% |
| Landry Jones | Oklahoma | 66.5% |
| Taylor Martinez | Nebraska | 65.1% |
| Jeff Tuel | Washington State | 64.5% |
| Jeff Driskel | Florida | 64.5% |
| Kevin Hogan | Stanford | 64.0% |
| Tajh Boyd | Clemson | 63.0% |
| Braxton Miller | Ohio State | 62.9% |
| Matt Barkley | USC | 61.7% |
| David Ash | Texas | 61.4% |
| Sean Mannion | Oregon State | 61.3% |
| Aaron Murray | Georgia | 61.1% |
| Ryan Nassib | Syracuse | 60.6% |
| Zach Mettenberger | LSU | 60.1% |
| Seth Doege | Texas Tech | 60.0% |
| Brett Hundley | UCLA | 60.0% |
| Kolton Browning | UL-Monroe | 59.6% |
| Cody Fajardo | Nevada | 59.4% |
| Tyler Russell | Mississippi State | 59.0% |
| Everett Golson | Notre Dame | 58.8% |
| Derek Carr | Fresno State | 58.0% |
| Matt Scott | Arizona | 57.6% |
| Conner Shaw | South Carolina | 57.6% |
| Kiehl Frazier | Auburn | 57.0% |
| Tyler Bray | Tennessee | 55.9% |
| Bo Wallace | Ole Miss | 55.6% |
| Keith Price | Washington | 55.4% |
| Dylan Thompson | South Carolina | 55.0% |
| Connor Halliday | Washington State | 54.6% |
| Max Wittek | USC | 52.4% |
| Trevone Boykin | TCU | 52.1% |
| Josh Nunes | Stanford | 50.8% |
| Stephen Morris | Miami | 48.8% |
| Andrew Maxwell | Michigan State | 48.7% |
That Teddy Bridgewater is awesome and Andrew Maxwell very much is not ... this is not a surprise. But seriously, what do we make of Collin Klein at this point? He isn't the quickest decision maker, he doesn't have a quick release, and he takes a lot of sacks in the pocket; but he is unafraid to step into the pocket and make throws, and ... he completes passes. With all applicable context involved (yes, defenses were more concerned with the run than the pass against Kansas State, and yes, this sample features some bad defenses like West Virginia's), Klein completed passes at a really high rate, and he did so without an Amari Cooper or Marqise Lee. And, of course, we know he can run the zone read that NFL offenses are finally discovering.
Another fun aspect of this list: look at the bunching. Manuel, McCarron, Florence, Mariota, Manziel, Smith and Jones are all within two percent of each other, and then there is a bit of a cascade down toward the middle, where Barkley, Ash, Mannion, Murray, Nassib, Mettenberger, Doege and Hundley are also bunched together.
Charting data allows us to evaluate a passer while stripping away some of the context that clouds the normal passing data. The plan for 2013 will be to chart many, many more games and get a broader sense for how quarterbacks perform within their chosen offense. But even this data-limited look tells us some things we might not have already known.