-format(webp)/cdn.vox-cdn.com/uploads/chorus_image/image/8087089/159090749.0.jpg)
Football is, by nature, a sport based on bursts. Only the craziest, oddest plays are going to last more than about 15 seconds, and when the play is over, you'll get at least about 20-30 seconds to recover from it. Boom, lull, boom, lull. It's not baseball in this regard, but it's not exactly a never-avert-your-eyes sport like hockey or, usually, soccer.
In this sense, the no-back formation is football on crack. Not only do you know something is probably going to happen in a short amount of time; you know that something's probably going to happen within about 1.2 seconds. There are few fakes, there are few slow-developing plays; there is just a snap and a nearly immediate action.
When an offense lines up in the no-back set, you know that in most instances you're either going to see a short, quick pass or a quarterback sneak. Sure, you can throw in a slow-developing jet sweep at times (when it comes to charting, if the jet sweep recipient is already in the backfield when the ball is snapped, it counts as one back in the backfield), and if your offensive line is better than the opponent's defensive line, perhaps your quarterback will have enough time to look downfield. But really, an offense lining up in a no-back set is basically admitting that it is going to do something immediate, and, really, predictable, with the ball. It seems no offense is confident enough to run a no-back full-time, perhaps because of that predictability, but as we'll see below, if a team needs to gain seven yards on a specific play, it has no problem leaning on the no-back.
For the 2012 Charting Project, we ended up with 15,504 plays with a listed formation. Here's the breakout of backs in the backfield at the snap.
| Backs | Plays |
% of All
Plays
|
| 0 | 836 | 5.4% |
| 1 | 9,380 | 60.5% |
| 2 | 4,580 | 29.5% |
| 3 | 700 | 4.5% |
| 4+ | 8 | 0.1% |
Football has changed through the years, but it really hasn't changed that much. Ninety percent of all plays are run with either one or two players in the backfield with the quarterback; I'm pretty sure those numbers wouldn't have been much different if this were 1997 or 1989 (though obviously the further back you go, the more the numbers would skew toward two backs instead of just one). So this post is talking about a formation that only shows up once per ever 20 plays or so.
That said, it is used almost twice as frequently in "we've got to move the chains right here" situations.
| Down | Frequency |
| First-and-10 | 3.8% |
| Second Down | 4.8% |
| 2nd-and-5 or fewer | 3.2% |
| 2nd-and-6 or more | 5.5% |
| Third Down | 9.5% |
| 3rd-and-2 or fewer | 1.8% |
| 3rd-and-3 or more | 10.9% |
| Fourth Down | 10.4% |
| 4th-and-2 or fewer | 5.9% |
| 4th-and-3 or more | 14.3% |
With run options limited to "QB up the middle," basically, this formation is built for quick passing. And it is the perfect formation for the spread ethos, which is often to peck you to death with seven-yard passes and hope you eventually miss a tackle that springs a big play.
| Type | % of Plays | Yds/Play |
| Pass | 78.0% | 6.3 |
| Run | 22.0% | 5.3 |
If your quarterback is good at reading defenses and determining exactly what he is going to do pre-snap, you can kill a defense with this formation. But as the much-higher-than-normal 7.8 percent sack rate would suggest, hesitation is deadly.
In all, when a no-back formation is employed, the quarterback isn't the only thing making something of an automatic read. The defense is likely doing the same thing. I spoke with research and analytics intern (and former Arizona State linebacker) Mike Nixon about this recently; at Arizona State, he said, the defense would have an automatic call when the offense showed no-back, and it was usually a blitz of some sort. Perhaps that call would change as a given game progressed, but knowing that a quick read was coming, a defense would fall back on its own quick read.
In my head, the no-back is an automatic blitz situation, especially considering it's often used on shorter passing downs third- or fourth-and-medium. I was a little bit surprised, then, to see this:
| # of pass rushers | Frequency | Yards Per Play |
| 2 | 0.6% | 4.8 |
| 3 | 20.2% | 8.1 |
| 4 | 56.8% | 6.3 |
| 5 | 16.9% | 4.5 |
| 6 | 5.5% | 4.6 |
Taking into account the fact that we had 3.5 percent of both three- and four-man rush situations documented as zone blitzes, that means that opponents only blitz against the no-back 25 percent of the time, choosing instead to rush four and react to the quarterback's quick read. Considering the results -- blitzing results in 4.5 yards per play, not blitzing results in 6.2 -- this appears to be a generally faulty approach. Not everybody takes the approach Arizona State did in the last part of the last decade, but perhaps they should. If a quarterback has time to find an open receiver, there are five of them running around for him to find. That's a lot to ask of a secondary.
So where does the quarterback throw when he has a chance to get the pass off?
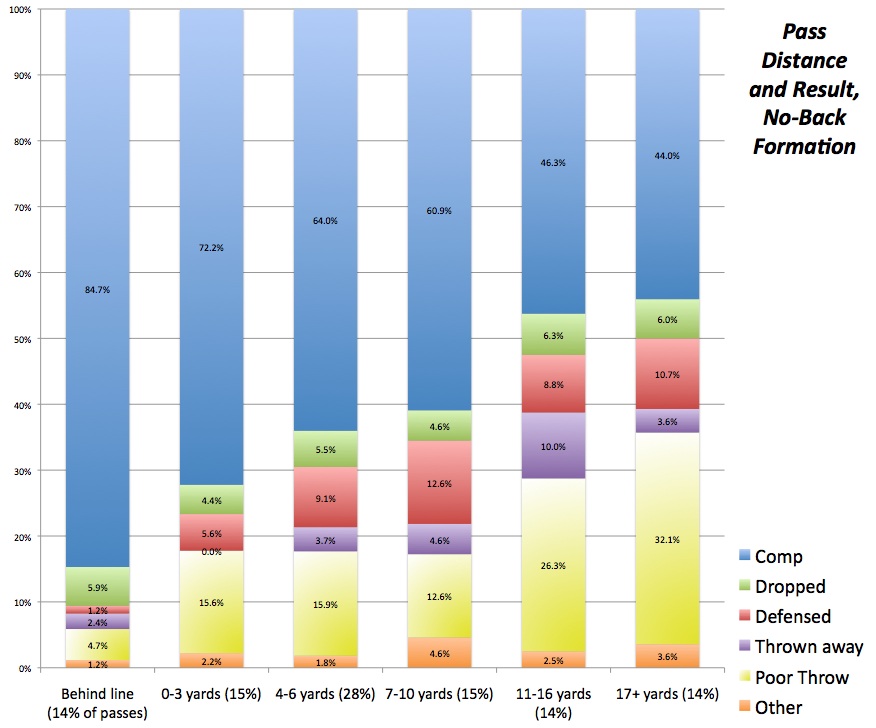
The general appeal of the no-back is at least partially because it offers quarterbacks both easy reads and easy throws. About 57 percent of the time, a quarterback's pass is travelling fewer than seven yards from the line of scrimmage. The completion rate for such passes is dramatically high; for passes thrown behind the line of scrimmage (typically a bubble screen), there is an 85 percent completion rate. And if you include drops and defensed passes (which are typically on passes considered catchable, yes?), a quarterback is going to throw a semi-accurate pass on a behind-the-line pass about 92 percent of the time. For passes between zero and 10 yards from the line of scrimmage, the percentage is about 80 percent, though obviously a defender is more likely to make a play on the ball the further you get from the line.
One can understand, then, why these formations might be popular on third-and-5.
(Personnel obviously also plays a role here, too; these are the most reliable plays in the playbook as long as you know the pass catcher is actually going to catch the pass.)
So who most effectively utilizes this formation? Remembering one key point -- that we are not working from a full, representative sample of games -- let's take a look at the teams in our data set that succeeded the most from the no-back.
| Team |
# of
No Back
|
% of
All Plays
|
Yds/
Play
|
Games Charted |
| Arizona | 11 | 3.4% | 15.9 | at Oregon, Oregon State, USC, vs Nevada |
| USC | 12 | 2.5% | 13.7 | vs Syracuse, at Stanford, at Arizona, Oregon, Notre Dame, at UCLA vs Georgia Tech |
| Notre Dame | 62 | 17.8% | 11.2 | at Michigan State, Miami, Stanford, at USC, vs Alabama |
| Tulsa | 10 | 10.6% | 11.2 | vs UCF |
| West Virginia | 43 | 7.3% | 11.2 | Marshall, Maryland, Baylor, at Texas, Kansas State, TCU, Oklahoma, vs Syracuse |
| Oregon State | 16 | 5.4% | 11.0 | at Arizona, Oregon, Utah, Washington State |
| Arizona State | 22 | 14.7% | 10.4 | Oregon, vs Navy |
| Miami | 21 | 16.9% | 10.4 | Florida State, at Notre Dame |
| Northwestern | 22 | 30.1% | 10.3 | vs Mississippi State |
Despite Rich Rodriguez's spread-'em-out tendencies, he does not go to the no-back well that often. In the four Arizona games we charted, Arizona only used the formation 11 times -- once against Oregon (on fourth-and-12 from the Oregon 20), once against Oregon State (second-and-10 from the 25), seven times against USC and twice against Nevada. In these plays, quarterback Matt Scott rushed three times for 33 yards and completed four of eight passes for 78 yards. The Wildcats' averages were skewed dramatically because of a single 60-yard bomb from Scott to Austin Hill on third-and-22 against USC. (This was indeed a bomb -- it traveled 29 yards in the air, and Hill took it another 31 yards after the catch -- and not a dink pass with a broken tackle.)
Really, the team that combined no-back frequency with effectiveness the best might have been Notre Dame. The Irish were known mostly for their defense, but even against the strong defenses listed in the above sample (Michigan State, Stanford and Alabama), they were tremendously effective from the no-back set. Quarterback Everett Golson was just 14-for-32 passing for 178 yards overall versus Michigan State, but from the no-back he was 9-for-14 for 122. (That means he was 5-for-18 for 56 otherwise.) In the first half versus USC, Golson was 7-for-13 for 115 yards from this look. Hell, even against Alabama, he was more successful in the no-back (5-for-8 for 71) than he was in other formations (16-for-28 for 199).
As a Missouri fan, I've always found the no-back both intriguing and rather appealing. That's what happens when you get to watch Chase Daniel operate out of it for three years. It can be devastating. But one thing I heard from both analysts and fans was that such a tactic just won't cut it in the SEC. The pass rushes are too good, the secondaries are too fast, etc. Granted, the no-back really didn't work very well for Missouri, which could have either been because of SEC defenses or the simple fact that nothing worked particularly well for Missouri with injuries rendering the Tigers to using a second-string quarterback behind a second-string offensive line. But the thought was almost that good defenses got even better against such a make-or-break formation. Is that true?
Not exactly. Below is a look at all of the teams that faced at least 10 plays versus a no-back set in our database. (Again, these are select games, not the entire season.) Compare the teams' performance versus all plays with the teams' performance versus no-back plays.
| Defense | All Plays | All Yards | Yds/Play |
No-Back
Plays
|
No-Back
Yards
|
No-Back
Yds/Play
|
Diff |
| Michigan | 132 | 816 | 6.18 | 10 | 7 | 0.70 | -5.48 |
| Arizona | 351 | 2311 | 6.58 | 10 | 38 | 3.80 | -2.78 |
| California | 138 | 901 | 6.53 | 15 | 57 | 3.80 | -2.73 |
| Texas A&M | 490 | 2504 | 5.11 | 20 | 48 | 2.40 | -2.71 |
| Oregon State | 290 | 1658 | 5.72 | 13 | 40 | 3.08 | -2.64 |
| West Virginia | 633 | 4094 | 6.47 | 19 | 80 | 4.21 | -2.26 |
| Notre Dame | 325 | 1578 | 4.86 | 29 | 92 | 3.17 | -1.68 |
| Florida | 533 | 2100 | 3.94 | 23 | 55 | 2.39 | -1.55 |
| Tennessee | 188 | 1613 | 8.58 | 18 | 135 | 7.50 | -1.08 |
| LSU | 792 | 3321 | 4.19 | 45 | 153 | 3.40 | -0.79 |
| Mississippi State | 366 | 2036 | 5.56 | 36 | 181 | 5.03 | -0.54 |
| Kansas State | 417 | 2538 | 6.09 | 29 | 170 | 5.86 | -0.22 |
| Auburn | 230 | 1523 | 6.62 | 17 | 112 | 6.59 | -0.03 |
| Florida State | 347 | 1410 | 4.06 | 24 | 106 | 4.42 | +0.35 |
| Grand Total | 15504 | 85710 | 5.53 | 836 | 4936 | 5.90 | +0.38 |
| Louisiana Tech | 65 | 388 | 5.97 | 12 | 79 | 6.58 | +0.61 |
| Utah State | 78 | 247 | 3.17 | 10 | 39 | 3.90 | +0.73 |
| Michigan State | 188 | 982 | 5.22 | 34 | 204 | 6.00 | +0.78 |
| Alabama | 846 | 3684 | 4.35 | 51 | 269 | 5.27 | +0.92 |
| Ohio | 78 | 313 | 4.01 | 46 | 228 | 4.96 | +0.94 |
| Oregon | 707 | 3718 | 5.26 | 29 | 180 | 6.21 | +0.95 |
| Oklahoma | 272 | 1916 | 7.04 | 11 | 91 | 8.27 | +1.23 |
| San Diego State | 137 | 621 | 4.53 | 11 | 64 | 5.82 | +1.29 |
| TCU | 157 | 588 | 3.75 | 13 | 67 | 5.15 | +1.41 |
| Ohio State | 190 | 1098 | 5.78 | 13 | 98 | 7.54 | +1.76 |
| Central Florida | 94 | 443 | 4.71 | 10 | 67 | 6.70 | +1.99 |
| Georgia | 385 | 1908 | 4.96 | 14 | 105 | 7.50 | +2.54 |
| Kent State | 86 | 492 | 5.72 | 19 | 158 | 8.32 | +2.59 |
| Louisville | 105 | 628 | 5.98 | 13 | 118 | 9.08 | +3.10 |
| USC | 541 | 3299 | 6.10 | 34 | 329 | 9.68 | +3.58 |
| Baylor | 248 | 1633 | 6.58 | 35 | 388 | 11.09 | +4.50 |
| Washington State | 502 | 2879 | 5.74 | 22 | 226 | 10.27 | +4.54 |
| Stanford | 594 | 2901 | 4.88 | 22 | 284 | 12.91 | +8.03 |
Honestly, one could make a pretty good case that the best way to know how to defend a no-back set is to run it pretty frequently yourself. California (8%), Texas A&M (15%), Oregon State (5%), West Virginia (7%), Notre Dame (18%), Florida (11%), and Mississippi State (12%) all utilized the no-back on offense at least five percent of the time, and all of these defenses fared better against the no-back on defense than it did against other formations. Meanwhile, teams like Stanford (3%), Washington State (0%!), USC (3%), Louisville (0%), Kent State (0%), Georgia (2%), UCF (1%)San Diego State (0%), Oklahoma (0.3%), Oregon (2%), Ohio (0%), and Alabama (2%) neither made frequent use of the no-back, nor fared amazingly well against it (at least compared to its other results). There are certainly examples suggesting otherwise -- Michigan shut down the no-back but didn't run it itself, while Ohio State and TCU each struggled with it a bit despite utilizing it frequently -- but it is the only approximate conclusion I can draw here.
[Note: It's been pointed out that there's really no significant relationship between your own offense and your defense's success. Just spitballing.]
The no-back formation is a wonderful curveball for a football offense. If you use it sparingly, it can be terribly efficient; as we see, it is quite useful when you absolutely need a small handful of yards. But coaches seem to think that if you use it too much, defenses will tee off on it. While a team like Notre Dame leaned on it often, it still used other formations four-fifths of the time. It is a formation that doesn't cater to one specific type of offense -- a spread team like Texas A&M used it a ton, while Washington State, led by one of the spread's most influential coaches, used it less frequently than even Alabama. It was an extreme rarity for Oregon, too, but Florida used it much more than one might have guessed. Few major league pitchers are capable of leaning on the curveball to great success, but if you've got it in your arsenal, your offense will benefit greatly from it.