Georgia consistently produces the fourth-most recruits in the country after the “Big Three” (Texas, Florida, and California), both in total FBS recruits and blue-chip talent. It also ranks second to only Louisiana in per-capita production of recruits (or third, if you include the District of Columbia), making Georgia one of the most fertile recruiting grounds in all of college football.
It is also an interesting state to consider because it is the most prolific exporter of blue-chip talent, with only two Power 5 programs located in the state (versus five, four, and three in Texas, California, and Florida, respectively), only one of whom is consistently successful in attracting blue-chip talent in meaningful quantities.
Recruits from Georgia account for eight percent of the total in my 13 year (2006-18) set of blue-chip recruits, with their numbers rising fairly steadily over time.
Georgia Blue Chips by Recruiting Class

Georgia’s Recruiting Landscape
Obviously the state of Georgia is in the heart of the Southeastern Conference, so it is unsurprising that SEC schools are the top destination for blue-chip talent graduating from high schools in the state. The degree to which top recruits from Georgia choose SEC schools over the ACC is still a bit surprising, with ACC member Georgia Tech located in Atlanta and conference powerhouses Florida State and Clemson located essentially right on the state’s Southern and Northeastern borders.
Over the 13-year sample, slightly over two thirds of Georgia blue-chip recruits have signed with SEC schools, compared to just a 20-percent share for the ACC. It is notable that the SEC’s share has declined slightly in recent years after bouncing around in the 75- to 80-percent range for most of the 2011-15 time frame, however.
Among other conferences, only the Big Ten and Pac-12 (based on current conference configurations) have managed to average more than a single Blue Chip a year from Georgia.

The University of Georgia is the top destination in the SEC, by a wide margin, which is unsurprising. The Bulldogs’ dominance in the state has been recently reasserted under Kirby Smart, after having waned in the last few years of Mark Richt’s head coaching tenure. While Richt’s up-and-down results on the field were probably the main reason for his ouster, it also seems likely that influential boosters were disturbed by Georgia’s falling “market share” with top-shelf in-state talent.
The table below shows the University of Georgia’s recent recruiting performance with Blue Chips in the state within the context of its overall recruiting effort and team on field performance. The blue shading denotes the transition class from Richt to Smart.

Following UGA, Auburn is the second leading destination for highly ranked Georgia recruits. Alabama, Tennessee, and South Carolina round out the remaining group that regularly dip into the Peach State and take top talent.
Among those, Alabama’s recruiting in the state has clearly declined in recent years, while South Carolina’s has been on the increase. Mississippi State, Arkansas, and Texas A&M have collectively recruited zero Georgia Blue Chips over the past 13 recruiting cycles.

ACC Border Programs Outperform Georgia Tech in the State
Clemson stands out as the most successful ACC program in the state. Clemson has landed 23 Blue Chips over the past 13 years. The Tigers’ stature within the state has grown over Dabo Swinney’s tenure as can be seen by the fact Clemson has landed 19 of those 23 over the past six seasons. Florida State and Georgia Tech lag slightly behind in terms of their total hauls, with 19 apiece, but those raw totals don’t really tell the story accurately.

Georgia Tech has landed a grand total of one Georgia blue-chipper over the past four recruiting classes, which puts it behind Miami, UNC, NC State, and Duke (!) among ACC rivals.
While GT’s rigorous academics focus certainly present a recruiting challenge, it is hard to view this performance as anything other than disastrous for a program located smack dab in the middle of Atlanta. Whether it is the academic challenges, Paul Johnson’s cantankerous personality, or the flexbone not resonating with highly-acclaimed recruits, something is seriously wrong there.
The table below shows Georgia Tech’s recent recruiting performance with Blue Chips in the state within the context of its overall recruiting effort and team on field performance. The blue shading denotes a transition class.

Drilling Down Geographically
The power of geo-coding and modern data visualization software is that is enables gaining spatial understanding of all sorts of data with a lot less effort than lower tech methods. While this has all sorts of applications, of course its highest and best use is for analysis of college football recruiting data. Or at least it is for people with a particular form of sickness.
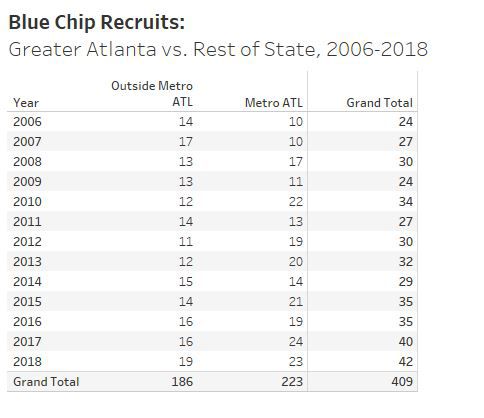
After I geo-coded the Georgia recruits, one of the first things I did was to tag the zip codes in the Atlanta Metropolitan Statistical Area in order to be able to easily differentiate high schools in Greater Atlanta from those in the rest of the state.
A simple tabulation of this data shows that Metro ATL produces about 55 percent of Georgia’s Blue Chips and that its share has been growing in recent years.
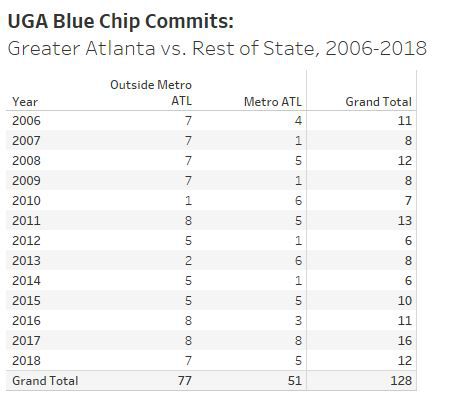
Applying the same filter to UGA’s blue-chip commits illustrates the fact that the Bulldogs have a much greater pull for top tier recruits outside of the Atlanta metro area than within it.
Finally, application of the geo-coding and a little bit of know-how (and I really only have a little bit) can result in a fairly useful interactive map, like the one presented below. Each dot represents a high school that has produced one or more Blue Chip recruits from 2006-18. The larger the dot, the more recruits it has produced. You can zoom in or out and if you hover over the school, it will provide detail on the recruits and their college destination.
If you have trouble operating it within the browser frame — it doesn’t seem to work for everyone for some reason — feel free to go to my Tableau online repository here.
Georgia Blue Chip Recruit Atlas

Loading comments...