I built a model this off-season to predict the home team's probability of winning the football game based on play-by-play information like the down, distance, spot on the field, time remaining, and the current lead. Also the model considers pre-game factors like who is home and if you are playing an FCS team. Here are the win probability charts for some of the big games in week 2.The colors in each chart represent who has the ball based on team color. If you want to see any other games then please just let me know in the comments.
Michigan State at Oregon
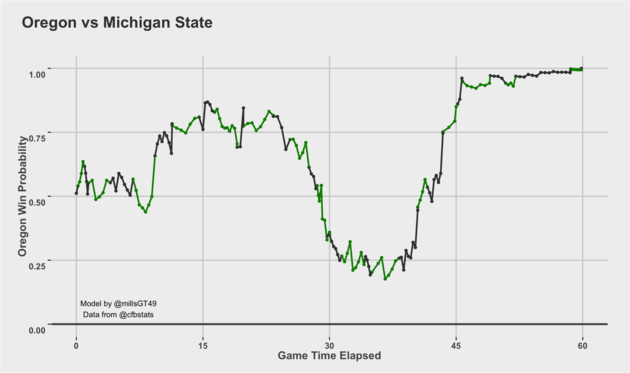
In a little over 5 minutes Oregon went from a 25% chance of winning to ~90%, wow.
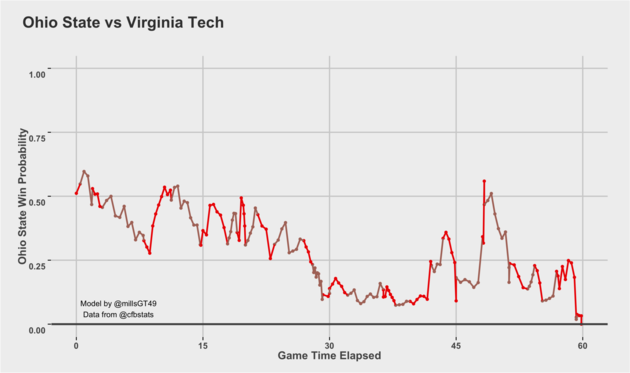
Virginia Tech at Ohio State
USC at Stanford
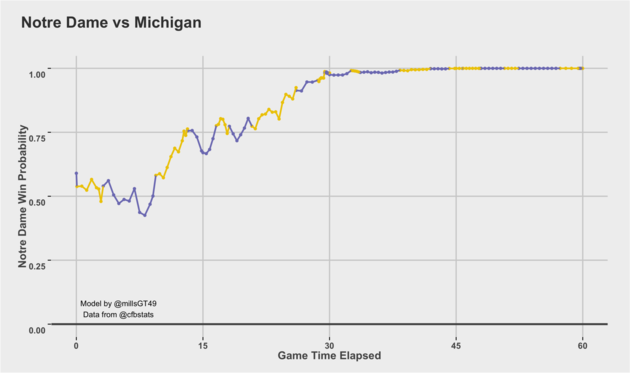
Michigan at Notre Dame
McNeese State at Nebraska
This is where the model has some trouble and could use some improvements. The model gives an FBS team a constant boost when playing FCS teams, but perhaps the boost should fade as the game progresses because this game was not over that quickly.
San Diego State at UNC
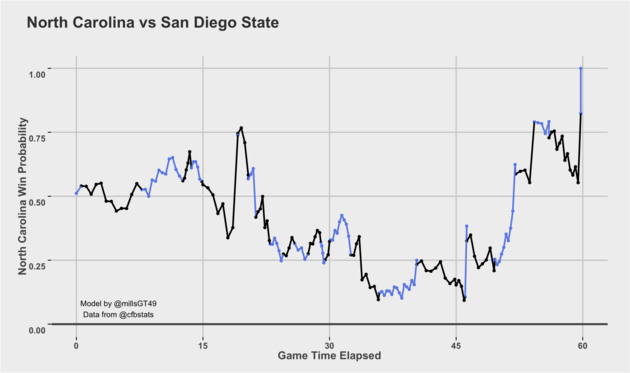
UNC had a huge 4th quarter comeback.
Kansas State at Iowa State
Man, there were some crazy finishes this week.
Like I said earlier, if you would like to see any more then please just request them in the comments.