-format(webp)/cdn.vox-cdn.com/uploads/chorus_image/image/18087967/20121201_tjg_sm8_696.0.jpg)
As a longtime (albeit recovering) recruiting addict, I have often wondered just how closely the talent accumulated by a football program is reflected in the results on the field. I certainly knew that there was some general correlation between strong recruiting and team strength, after all USC and Florida are usually pretty strong teams, whereas Eastern Michigan and Idaho are, well, Eastern Michigan and Idaho. But I wanted to really look at how much teams’ accumulated talent, per the recruiting services, explained their success (or lack thereof) on the field.
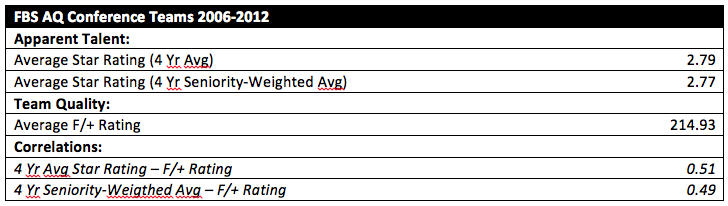
In order to study this question I downloaded and tabulated recruiting data for all FBS teams from 2002 through 2012. Ideally I would include multiple sources of recruiting data and calculate a consensus recruiting rating, but given how labor intensive that step was I utilized only the ratings from Scout.com to start with. Once I had the data all arrayed and scrubbed, I calculated average star ratings for each program each year. I decided to utilize average star ratings rather than class rank because class rankings are heavily influenced by the number of commits in a class. Since I would be looking at a four year average of the talent, I wanted to just look at the "pure talent" without regard to lumpiness in the size of the individual classes. I calculated two measures of what I am calling Apparent Talent; the first was a simple four year moving average of class star averages. The second measure was one I felt was slightly more realistic: a weighted average that gives more value to classes three and four years ago, to account for the fact that upperclassmen usually start and play more than younger players.
I used FO's F/+ rating as an objective measure of team quality. I felt this would be a more appropriate measure than something like winning percentage, since I definitely wanted to adjust for team SOS. I also conducted analyses using S&P+, FEI and Sagarin’s Predictor rating. They all looked similar, give or take an outlier here or there. Since F/+ has the highest correlation with winning percentage of all of those advanced metrics, I decided to use it as the primary proxy for quality.
Finally, I limited my analysis to only programs from FBS Automatic Qualifier conferences, for a couple of reasons. First, I wanted to pare the data down to a manageable size. Second, and equally important, when I really inspected the recruiting data and thought about it I became concerned that the quality of the recruiting ratings for players that went to most non-AQ schools was probably inferior. It is a simple matter of economics, really. The recruiting services get several sets of eyes on the players who end up going to schools in which there is a lot of interest (i.e. schools from the AQ "power" conferences), and therefore a lot of paying subscribers, but likely expend less effort evaluating PSAs destined for college football’s relative backwaters.
A Definite Correlation
Not surprisingly, there was a definite and fairly strong correlation between Apparent Talent and team quality (as measured by F/+). The correlation coefficient between the simple 4 year Average star rating and the Predictor was 0.51. Interestingly enough, the correlation with my age-weighted model was actually slightly lower, at 0.49. This was based on sample of 466 observations: all seasons for teams in the ACC, Big East, Big 10, Big XII, Pac-10/12, and SEC from 2006 through 2012.
In order to further explore the relationship between Apparent Talent and Team Quality I calculated departures from average on both metrics for every squad in the sample and plotted them on a scatter plot. I also ran a simple linear regression. I thought utilizing departures from average would make interpretation of the data more intuitive. For instance, it stands to reason that a team that is 40% better than average in terms of Apparent Talent ought to be significantly better than average in terms of Team Quality, but how much better?
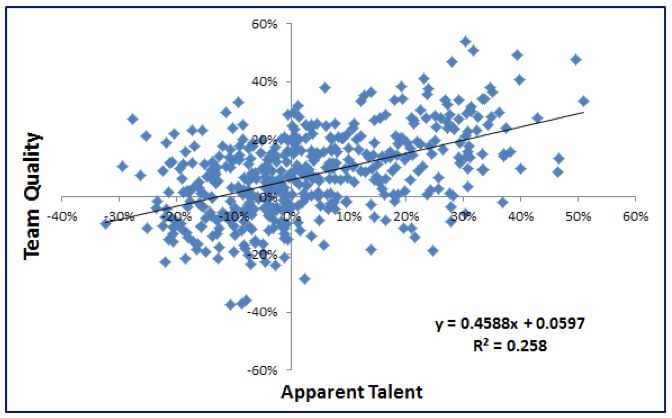
As it turns out the leverage of apparent talent on team quality is a lot less than a 1:1 ratio. In fact, based on the regression, the leverage (or Beta, or slope of the regression line) is approximately 0.46. Simply stated, at team with 40% better than average talent (for an FBS AQ school) would be expected to be 18% better than the average FBS AQ team in terms of F/+ rating.
What Good is This?
That’s a really fair question. For one thing, it fairly conclusively dispels a notion still held by some college football neo-Luddites. Namely, that "recruiting rankings don’t matter". They pretty clearly do.
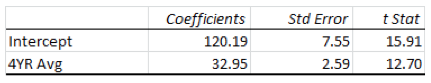
For the real stats nerds, here is the regression output of a simple linear regression of F/+ rating for each FBS AQ team from 2006-2012, versus the simple arithmetic average star rating for the previous 4 recruiting classes, per the Scout database:
Yeah, but Other than Proving the Sky is Blue, What Good is This?
This is the part that is really interesting. While this model has some predictive power, it is still very simple and crude and probably not something I would want to use to say…put futures bets down on teams at a Vegas sports book. For instance, it isn’t as predictive as a simple naïve forecast that a team would have the exact same F/+ rating in a given season as it had in the previous one. And how could it be? That sort of naïve forecast has the advantage of capturing much of the same talent information (since the 4 year average recruiting ratings don’t move that much in a single year), while also capturing a whole host of other factors…like how those players are actually doing playing the game of football.
But the fact this model doesn’t capture those things actually makes it pretty useful for other purposes. Consider this simple conceptual model of team quality:
Team Quality (F/+Rating) = Apparent Talent + Coaching Effect + "Noise"
College football is a dreadfully complicated endeavor to model statistically, as you are doubtless aware. By using F/+ Rating we have already largely factored out a lot of the random in-game stuff, like bad bounces that result in one point losses, untimely misses by a walk-on field goal kicker, and so on. In this theoretical model, the "noise" factor includes a whole host of stuff ranging from key players being suspended, scandals turning the mojo around a program decidedly poor, to a whole cohort of players turning out to be grossly overrated. As anybody who follows college football knows, this stuff happens and can definitely affect how a team performs on the field, but from a statistical perspective it is truly unknowable, random and therefore can’t be considered.
The remaining piece of the puzzle is what I am calling "Coaching Effect", but refers not only to game prep and game-day coaching, but scheme, S&C program, and talent evaluation--coaches that routinely have better results than recruiting rankings indicate they should are probably doing a better job of evaluating the available talent than the ratings services are doing.
It stands to reason that over time, strong coaching staffs ought to consistently and measurably outperform (or at least perform in line) with the available talent on hand and weaker staffs will underachieve (sometimes spectacularly). Using the Apparent Talent metric and the simple model described above, we can statistically measure how well a staff performs, both in single season and over time. Of course even good coaches can have an outlier year to the downside and even lousy coaches are fortunate once in a while (cough, cough…Gene Chizik), but consistent deviation from what is predicted by the model ought to be statistically unlikely enough that it should indicate something about coaching performance. And as with most data of this kind, the really large outliers are very interesting.
The methodology was pretty simple. I calculated expected F/+ rating for each season for all AQ teams from 2006 to 2012, based on the Apparent Talent (four year star average), then compared it to the final actual F/+ for each team. I then normalized the deviations from the expected values using the standard deviation of the differences (Std Delta).
For example, the 2008 Washington Huskies were an approximately average team in terms of talent, with an Apparent Talent rating of 2.85. Based on that, they would have been expected to be an approximately average team; the model yielded a projected F/+ of 214.0. Instead, the team went 0-12 with a final F/+ rating of 143.3, just over 33%--or 2.77 standard deviations—worse than the model predicted.
The Best & Worst Coaching Effects on F/+ (AQ Teams, 2006-2012)
| Year | School | 4YR Avg | vs Avg | Est. | Actual | ∆% | ∆ | Coach | Comments | |||
| 2012 | Kansas State | 2.02 | -28% | 186.6 | 253.7 | 36% | 3.02 | Snyder | Best season relative to apparent talent by a wide margin. | |||
| 2007 | West Virginia | 2.53 | -9% | 203.5 | 265.4 | 30% | 2.55 | Rodriguez | The '06 & '07 West Virginia teams validated spread-to-run approach | |||
| 2006 | Louisville | 2.47 | -11% | 201.4 | 258.5 | 28% | 2.38 | Petrino | Petrino outperformed at Louisville before he did at Arkansas. | |||
| 2007 | Cincinnati | 2.08 | -25% | 188.6 | 242.1 | 28% | 2.38 | B. Kelly | Best year of a strong run at Cinci | |||
| 2011 | Alabama | 3.63 | 30% | 239.9 | 307.8 | 28% | 2.37 | Saban | Outperforming with well above average talent is a powerful combo | |||
| 2011 | Oklahoma State | 2.95 | 6% | 217.3 | 275.8 | 27% | 2.26 | Gundy | The year after Dana Holgorsen left Stillwater. | |||
| 2007 | Kansas | 2.22 | -20% | 193.3 | 244.1 | 26% | 2.21 | Mangino | Unlikely to see another year from KU like this in the near future. | |||
| 2007 | South Florida | 2.31 | -17% | 196.1 | 245.9 | 25% | 2.13 | Leavitt | Sometimes yellers get results. | |||
| 2012 | Alabama | 3.67 | 32% | 241.1 | 301.3 | 25% | 2.09 | Saban | Saban is every bit as good as his reputation. | |||
| 2006 | West Virginia | 2.36 | -15% | 197.8 | 245.8 | 24% | 2.03 | Rodriguez | The '06 & '07 West Virginia teams validated spread-to-run approach | |||
| 2006 | Rutgers | 2.18 | -22% | 192.0 | 237.4 | 24% | 1.98 | Schiano | Had very strong years in '06 & '07, then flatlined. | |||
| 2011 | LSU | 3.57 | 28% | 237.7 | 293.6 | 24% | 1.98 | Miles | All the Mad Hatter's other years at LSU average out to…average | |||
| 2009 | Virginia Tech | 2.82 | 1% | 212.9 | 263.0 | 24% | 1.97 | Beamer | Beamerball may not be artistic, but it is effective | |||
| 2009 | Iowa | 2.55 | -9% | 204.1 | 250.2 | 23% | 1.89 | Ferentz | Peak of a three year spike from average. | |||
| 2007 | Missouri | 2.50 | -10% | 202.6 | 247.7 | 22% | 1.87 | Pinkel | Best year for a guy who is probably underrated. | |||
| 2011 | Wisconsin | 2.79 | 0% | 212.2 | 258.6 | 22% | 1.83 | Bielema | Bielema's teams consistently outperformed in Big 10, will they in SEC? | |||
| 2010 | Arkansas | 2.77 | -1% | 211.5 | 257.1 | 22% | 1.81 | Petrino | Petrino had gotten Arkansas on a roll before scandal | |||
| 2010 | Auburn | 3.17 | 14% | 224.6 | 272.9 | 21% | 1.80 | Chizik | Cam Newton Effect | |||
| 2009 | Alabama | 3.43 | 23% | 233.1 | 282.4 | 21% | 1.77 | Saban | Outperforming with well above average talent is a powerful combo | |||
| 2012 | Texas A&M | 3.14 | 13% | 223.6 | 270.2 | 21% | 1.75 | Sumlin | Johnny Manziel Effect? Will it be as short-lived as Newton's? | |||
| 2012 | Oregon | 3.32 | 19% | 229.5 | 276.6 | 21% | 1.72 | C. Kelly | Oregon's run from Kelly joining staff was pretty epic | |||
| 2008 | Florida | 3.88 | 39% | 248.1 | 298.7 | 20% | 1.71 | Meyer | High level talent + perfect system QB + great coach = Super Elite team | |||
| 2007 | Oregon | 2.83 | 1% | 213.3 | 255.6 | 20% | 1.67 | Bellotti | First year with Chip Kelly as Offensive Coordinator | |||
| 2007 | Connecticut | 1.97 | -29% | 185.0 | 221.5 | 20% | 1.65 | Edsall | Team should have been awful, instead was slightly above average | |||
| 2009 | Cincinnati | 2.31 | -17% | 196.4 | 235.1 | 20% | 1.65 | B. Kelly | Notre Dame may finally have the right coach… | |||
| 2010 | Stanford | 3.13 | 12% | 223.2 | 266.4 | 19% | 1.62 | Harbaugh | Tempting to attribute this to Luck (rimshot!), but probably unfair | |||
| 2007 | Kentucky | 2.27 | -18% | 195.1 | 231.6 | 19% | 1.57 | Brooks | Trying to remember why Kentucky let Brooks go | |||
| 2010 | Alabama | 3.45 | 24% | 233.8 | 274.9 | 18% | 1.48 | Saban | ||||
| 2010 | Wisconsin | 2.79 | 0% | 212.1 | 249.2 | 17% | 1.47 | Bielema | ||||
| 2012 | Oregon State | 2.55 | -8% | 204.2 | 239.9 | 17% | 1.47 | Riley | ||||
| 2011 | Oregon | 3.29 | 18% | 228.4 | 267.5 | 17% | 1.44 | C. Kelly | ||||
| 2006 | Boston College | 2.45 | -12% | 201.0 | 235.2 | 17% | 1.43 | O'Brien | ||||
| 2007 | Virginia Tech | 2.86 | 3% | 214.3 | 250.1 | 17% | 1.40 | Beamer | ||||
| 2008 | Penn State | 3.32 | 19% | 229.7 | 268.1 | 17% | 1.40 | Paterno | ||||
| 2008 | Cincinnati | 2.21 | -21% | 192.9 | 224.3 | 16% | 1.37 | B. Kelly | ||||
| 2008 | Ole Miss | 2.88 | 3% | 215.1 | 250.0 | 16% | 1.36 | Nutt | ||||
| 2010 | Missouri | 2.80 | 1% | 212.5 | 246.6 | 16% | 1.34 | Pinkel | ||||
| 2010 | Virginia Tech | 2.91 | 4% | 216.0 | 250.6 | 16% | 1.34 | Beamer | ||||
| 2008 | Connecticut | 2.20 | -21% | 192.5 | 223.3 | 16% | 1.34 | Edsall | ||||
| 2008 | Oklahoma | 3.44 | 24% | 233.6 | 270.8 | 16% | 1.34 | B. Stoops | ||||
| 2006 | Wisconsin | 2.54 | -9% | 203.7 | 235.4 | 16% | 1.31 | Bielema | ||||
| 2008 | Missouri | 2.64 | -5% | 207.3 | 239.4 | 16% | 1.30 | Pinkel | ||||
| 2006 | Arkansas | 2.60 | -7% | 205.8 | 237.4 | 15% | 1.29 | Nutt | ||||
| 2007 | Boston College | 2.49 | -11% | 202.2 | 232.9 | 15% | 1.28 | Jagodzinski | ||||
| 2011 | Michigan State | 2.88 | 3% | 215.0 | 247.6 | 15% | 1.27 | Dantonio | ||||
| 2010 | Oklahoma State | 2.95 | 6% | 217.5 | 249.6 | 15% | 1.24 | Gundy | ||||
| 2008 | USC | 4.16 | 49% | 257.3 | 295.2 | 15% | 1.23 | Carroll | ||||
| 2008 | Texas Tech | 2.75 | -1% | 210.9 | 241.4 | 14% | 1.22 | Leach | ||||
| 2009 | Connecticut | 2.26 | -19% | 194.7 | 222.8 | 14% | 1.21 | Edsall | ||||
| 2012 | Oklahoma State | 3.00 | 8% | 218.9 | 250.5 | 14% | 1.21 | Gundy | ||||
| 2006 | Cincinnati | 2.06 | -26% | 187.9 | 215.1 | 14% | 1.21 | B. Kelly | ||||
| 2010 | Iowa | 2.60 | -7% | 205.9 | 235.4 | 14% | 1.21 | Ferentz | ||||
| 2008 | Wake Forest | 2.30 | -17% | 196.1 | 223.8 | 14% | 1.19 | Grobe | ||||
| 2009 | Wisconsin | 2.74 | -2% | 210.4 | 240.1 | 14% | 1.18 | Bielema | ||||
| 2008 | Iowa | 2.80 | 1% | 212.5 | 242.2 | 14% | 1.17 | Ferentz | ||||
| 2011 | Cincinnati | 2.43 | -13% | 200.3 | 228.1 | 14% | 1.16 | B. Jones | ||||
| 2009 | Oregon State | 2.58 | -7% | 205.1 | 233.4 | 14% | 1.16 | Riley | ||||
| 2006 | South Florida | 2.16 | -22% | 191.4 | 217.8 | 14% | 1.15 | Leavitt | ||||
| 2009 | Florida | 3.89 | 40% | 248.4 | 281.6 | 13% | 1.12 | Meyer | ||||
| 2006 | Virginia Tech | 2.77 | -1% | 211.4 | 239.5 | 13% | 1.12 | Beamer | ||||
| 2006 | Wake Forest | 2.25 | -19% | 194.2 | 219.9 | 13% | 1.11 | Grobe | ||||
| 2007 | Clemson | 2.89 | 4% | 215.3 | 243.7 | 13% | 1.11 | T. Bowden | ||||
| 2011 | Stanford | 3.25 | 17% | 227.1 | 256.9 | 13% | 1.10 | Shaw | ||||
| 2009 | Nebraska | 3.09 | 11% | 221.9 | 251.0 | 13% | 1.10 | Pellini | ||||
| 2009 | Texas | 3.75 | 35% | 243.8 | 275.7 | 13% | 1.10 | Brown | ||||
| 2007 | Ohio State | 3.53 | 27% | 236.6 | 266.9 | 13% | 1.07 | Tressel | ||||
| 2011 | Kansas State | 2.40 | -14% | 199.3 | 224.4 | 13% | 1.06 | Snyder | ||||
| 2008 | Alabama | 3.22 | 16% | 226.2 | 254.7 | 13% | 1.06 | Saban | ||||
| 2007 | Oregon State | 2.49 | -11% | 202.1 | 227.5 | 13% | 1.06 | Riley | ||||
| 2011 | Arkansas | 2.83 | 1% | 213.3 | 239.7 | 12% | 1.04 | Petrino | ||||
| 2011 | Wisconsin | 2.86 | 3% | 214.3 | 240.8 | 12% | 1.03 | Bielema | ||||
| 2012 | Cincinnati | 2.53 | -9% | 203.6 | 228.7 | 12% | 1.03 | B. Jones | ||||
| 2010 | Oregon | 3.19 | 15% | 225.3 | 253.0 | 12% | 1.03 | C. Kelly | ||||
| 2007 | Rutgers | 2.37 | -15% | 198.1 | 222.4 | 12% | 1.03 | Schiano | ||||
| 2009 | Penn State | 3.41 | 22% | 232.5 | 260.6 | 12% | 1.01 | Paterno | ||||
| 2007 | LSU | 3.60 | 29% | 238.7 | 267.4 | 12% | 1.01 | Miles | ||||
| 2010 | NC State | 2.71 | -3% | 209.5 | 234.3 | 12% | 0.99 | O'Brien | ||||
| 2008 | Texas | 3.76 | 35% | 244.2 | 273.0 | 12% | 0.99 | Brown | ||||
| 2009 | Texas Tech | 2.80 | 0% | 212.3 | 237.3 | 12% | 0.99 | Leach | ||||
| 2012 | South Carolina | 3.08 | 11% | 221.8 | 247.4 | 12% | 0.97 | Spurrier | ||||
| 2007 | Arkansas | 2.64 | -5% | 207.0 | 230.7 | 11% | 0.96 | Nutt | ||||
| 2008 | Boston College | 2.52 | -9% | 203.3 | 226.3 | 11% | 0.95 | Jagodzinski | ||||
| 2006 | LSU | 3.55 | 27% | 237.0 | 263.8 | 11% | 0.95 | Miles | ||||
| 2009 | Boston College | 2.50 | -10% | 202.6 | 224.9 | 11% | 0.92 | Spaziani | ||||
| 2006 | Georgia Tech | 2.54 | -9% | 203.7 | 226.0 | 11% | 0.92 | Gailey | ||||
| 2012 | Michigan State | 2.97 | 7% | 218.1 | 241.4 | 11% | 0.89 | Dantonio | ||||
| 2012 | Florida | 3.71 | 33% | 242.5 | 268.3 | 11% | 0.89 | Muschamp | ||||
| 2007 | Illinois | 2.69 | -3% | 208.9 | 230.8 | 10% | 0.88 | Zook | ||||
| 2011 | Baylor | 2.59 | -7% | 205.4 | 226.9 | 10% | 0.88 | Briles | ||||
| 2010 | South Carolina | 3.06 | 10% | 220.9 | 243.9 | 10% | 0.87 | Spurrier | ||||
| 2010 | Ohio State | 3.73 | 34% | 242.9 | 267.9 | 10% | 0.86 | Tressel | ||||
| 2012 | Syracuse | 2.42 | -13% | 200.0 | 220.5 | 10% | 0.86 | Marrone | ||||
| 2007 | Auburn | 3.01 | 8% | 219.5 | 241.7 | 10% | 0.85 | Tuberville | ||||
| 2007 | Oklahoma | 3.37 | 21% | 231.2 | 254.6 | 10% | 0.85 | B. Stoops | ||||
| 2007 | Arizona State | 2.77 | -1% | 211.5 | 232.5 | 10% | 0.83 | Erickson | ||||
| 2006 | Missouri | 2.47 | -11% | 201.6 | 221.6 | 10% | 0.83 | Pinkel | ||||
| 2008 | South Florida | 2.40 | -14% | 199.2 | 218.9 | 10% | 0.83 | Leavitt | ||||
| 2006 | Clemson | 2.81 | 1% | 212.9 | 233.9 | 10% | 0.83 | T. Bowden | ||||
| 2010 | West Virginia | 2.98 | 7% | 218.4 | 239.7 | 10% | 0.82 | Stewart | ||||
| 2010 | Michigan State | 2.70 | -3% | 209.2 | 229.5 | 10% | 0.82 | Dantonio | ||||
| 2007 | Wake Forest | 2.25 | -19% | 194.4 | 212.9 | 10% | 0.80 | Grobe | ||||
| 2010 | Nebraska | 3.03 | 9% | 220.1 | 240.6 | 9% | 0.78 | Pellini | ||||
| 2007 | Texas Tech | 2.68 | -4% | 208.6 | 227.9 | 9% | 0.78 | Leach | ||||
| 2009 | Oregon | 3.03 | 9% | 219.9 | 240.3 | 9% | 0.78 | C. Kelly | ||||
| 2011 | Michigan | 3.38 | 21% | 231.5 | 252.8 | 9% | 0.77 | Hoke | ||||
| 2006 | Florida | 3.66 | 31% | 240.8 | 262.5 | 9% | 0.76 | Meyer | ||||
| 2009 | Oklahoma | 3.44 | 23% | 233.5 | 254.5 | 9% | 0.76 | B. Stoops | ||||
| 2006 | Ohio State | 3.48 | 25% | 234.9 | 256.0 | 9% | 0.75 | Tressel | ||||
| 2006 | Oregon State | 2.42 | -13% | 199.8 | 217.5 | 9% | 0.75 | Riley | ||||
| 2008 | Rutgers | 2.49 | -11% | 202.2 | 220.1 | 9% | 0.74 | Schiano | ||||
| 2008 | Oklahoma State | 2.84 | 2% | 213.6 | 232.4 | 9% | 0.74 | Gundy | ||||
| 2008 | Oregon State | 2.58 | -8% | 205.0 | 223.0 | 9% | 0.74 | Riley | ||||
| 2012 | Louisville | 2.71 | -3% | 209.4 | 227.5 | 9% | 0.72 | Strong | ||||
| 2009 | Arkansas | 2.75 | -1% | 210.8 | 228.9 | 9% | 0.72 | Petrino | ||||
| 2012 | Northwestern | 2.67 | -4% | 208.2 | 225.9 | 8% | 0.71 | Fitzgerald | ||||
| 2012 | Stanford | 3.38 | 21% | 231.5 | 251.1 | 8% | 0.71 | Shaw | ||||
| 2011 | Texas A&M | 3.13 | 12% | 223.2 | 242.1 | 8% | 0.71 | Sherman | ||||
| 2006 | South Carolina | 2.79 | 0% | 212.2 | 230.1 | 8% | 0.71 | Spurrier | ||||
| 2010 | Oklahoma | 3.56 | 28% | 237.3 | 256.8 | 8% | 0.69 | B. Stoops | ||||
| 2012 | Notre Dame | 3.51 | 26% | 235.9 | 254.9 | 8% | 0.67 | B. Kelly | ||||
| 2011 | West Virginia | 2.88 | 4% | 215.2 | 232.4 | 8% | 0.67 | Holgorsen | ||||
| 2012 | Baylor | 2.68 | -4% | 208.4 | 225.0 | 8% | 0.67 | Briles | ||||
| 2009 | Wake Forest | 2.38 | -15% | 198.4 | 214.2 | 8% | 0.66 | Grobe | ||||
| 2012 | Nebraska | 3.10 | 11% | 222.3 | 239.8 | 8% | 0.66 | Pellini | ||||
| 2011 | Vanderbilt | 2.42 | -13% | 199.8 | 215.5 | 8% | 0.66 | Franklin | ||||
| 2012 | Florida State | 3.66 | 31% | 240.7 | 259.0 | 8% | 0.64 | Fisher | ||||
| 2012 | Georgia | 3.64 | 31% | 240.0 | 258.2 | 8% | 0.64 | Richt | ||||
| 2012 | TCU | 2.72 | -3% | 209.6 | 224.6 | 7% | 0.60 | Patterson | ||||
| 2009 | Ole Miss | 3.00 | 8% | 219.0 | 233.8 | 7% | 0.57 | Nutt | ||||
| 2006 | Auburn | 2.98 | 7% | 218.3 | 233.1 | 7% | 0.57 | Tuberville | ||||
| 2009 | Purdue | 2.40 | -14% | 199.2 | 212.7 | 7% | 0.57 | Hope | ||||
| 2008 | West Virginia | 2.67 | -4% | 208.0 | 222.0 | 7% | 0.56 | Stewart | ||||
| 2008 | North Carolina | 2.91 | 4% | 216.0 | 230.4 | 7% | 0.56 | B. Davis | ||||
| 2009 | Georgia Tech | 2.94 | 6% | 217.1 | 231.6 | 7% | 0.56 | P. Johnson | ||||
| 2008 | Northwestern | 2.34 | -16% | 197.2 | 210.0 | 7% | 0.55 | Fitzgerald | ||||
| 2012 | Oklahoma | 3.60 | 29% | 238.7 | 253.9 | 6% | 0.53 | B. Stoops | ||||
| 2012 | LSU | 3.55 | 27% | 237.0 | 251.9 | 6% | 0.53 | Miles | ||||
| 2008 | Oregon | 2.98 | 7% | 218.5 | 232.1 | 6% | 0.52 | Bellotti | ||||
| 2011 | Rutgers | 2.76 | -1% | 211.1 | 224.2 | 6% | 0.52 | Schiano | ||||
| 2011 | Missouri | 2.91 | 5% | 216.2 | 229.1 | 6% | 0.50 | Pinkel | ||||
| 2011 | Virginia Tech | 2.88 | 4% | 215.2 | 228.0 | 6% | 0.50 | Beamer | ||||
| 2012 | Arizona | 2.64 | -5% | 207.3 | 219.6 | 6% | 0.50 | Rodriguez | ||||
| 2008 | Vanderbilt | 2.19 | -21% | 192.4 | 203.6 | 6% | 0.49 | Bo. Johnson | ||||
| 2009 | Pittsburgh | 3.29 | 18% | 228.7 | 241.9 | 6% | 0.49 | Wannstedt | ||||
| 2011 | Oklahoma | 3.69 | 32% | 241.7 | 255.4 | 6% | 0.48 | B. Stoops | ||||
| 2011 | Florida State | 3.49 | 25% | 235.1 | 248.3 | 6% | 0.47 | Fisher | ||||
| 2006 | California | 3.06 | 10% | 221.1 | 233.5 | 6% | 0.47 | Tedford | ||||
| 2007 | Florida | 3.80 | 36% | 245.2 | 258.9 | 6% | 0.47 | Meyer | ||||
| 2011 | South Carolina | 3.01 | 8% | 219.4 | 231.5 | 6% | 0.46 | Spurrier | ||||
| 2010 | Texas A&M | 3.19 | 14% | 225.2 | 237.7 | 6% | 0.46 | Sherman | ||||
| 2008 | Kansas | 2.43 | -13% | 200.3 | 211.1 | 5% | 0.45 | Mangino | ||||
| 2007 | Michigan State | 2.60 | -7% | 205.7 | 216.7 | 5% | 0.45 | Dantonio | ||||
| 2006 | Oklahoma State | 2.66 | -4% | 207.9 | 218.6 | 5% | 0.43 | Gundy | ||||
| 2011 | South Florida | 2.67 | -4% | 208.2 | 218.8 | 5% | 0.43 | S. Holtz | ||||
| 2006 | Kentucky | 2.31 | -17% | 196.2 | 206.1 | 5% | 0.42 | Brooks | ||||
| 2006 | Tennessee | 3.32 | 19% | 229.7 | 241.0 | 5% | 0.41 | Fulmer | ||||
| 2007 | Mississippi State | 2.42 | -13% | 199.9 | 209.7 | 5% | 0.41 | Croom | ||||
| 2009 | Clemson | 3.32 | 19% | 229.4 | 240.5 | 5% | 0.40 | Swinney | ||||
| 2007 | Wisconsin | 2.61 | -6% | 206.2 | 216.1 | 5% | 0.40 | Bielema | ||||
| 2009 | Ohio State | 3.76 | 35% | 244.0 | 255.6 | 5% | 0.40 | Tressel | ||||
| 2008 | Pittsburgh | 3.11 | 12% | 222.7 | 233.3 | 5% | 0.40 | Wannstedt | ||||
| 2012 | Iowa State | 2.28 | -18% | 195.2 | 204.4 | 5% | 0.39 | Rhoads | ||||
| 2009 | Northwestern | 2.34 | -16% | 197.1 | 206.0 | 5% | 0.38 | Fitzgerald | ||||
| 2006 | Nebraska | 2.89 | 4% | 215.5 | 225.1 | 4% | 0.38 | Callahan | ||||
| 2007 | Georgia | 3.55 | 27% | 237.0 | 247.6 | 4% | 0.37 | Richt | ||||
| 2007 | Louisville | 2.69 | -3% | 208.8 | 218.1 | 4% | 0.37 | Kragthorpe | ||||
| 2006 | Kansas | 2.26 | -19% | 194.7 | 203.4 | 4% | 0.37 | Mangino | ||||
| 2010 | Cincinnati | 2.29 | -18% | 195.5 | 203.9 | 4% | 0.36 | B. Jones | ||||
| 2010 | Mississippi State | 2.81 | 1% | 212.8 | 221.8 | 4% | 0.35 | Mullen | ||||
| 2008 | Michigan State | 2.56 | -8% | 204.5 | 213.0 | 4% | 0.35 | Dantonio | ||||
| 2006 | Michigan | 3.57 | 28% | 237.9 | 247.4 | 4% | 0.34 | Carr | ||||
| 2006 | Minnesota | 2.29 | -18% | 195.6 | 203.2 | 4% | 0.33 | Mason | ||||
| 2011 | Notre Dame | 3.58 | 28% | 238.0 | 246.9 | 4% | 0.31 | B. Kelly | ||||
| 2010 | Maryland | 2.73 | -2% | 210.2 | 217.9 | 4% | 0.30 | Friedgen | ||||
| 2010 | Illinois | 2.82 | 1% | 213.2 | 220.8 | 4% | 0.30 | Zook | ||||
| 2012 | Vanderbilt | 2.57 | -8% | 205.0 | 212.2 | 4% | 0.30 | Franklin | ||||
| 2006 | Vanderbilt | 2.14 | -23% | 190.5 | 197.0 | 3% | 0.29 | Bo. Johnson | ||||
| 2012 | Clemson | 3.31 | 19% | 229.1 | 236.7 | 3% | 0.28 | Swinney | ||||
| 2010 | Florida State | 3.35 | 20% | 230.5 | 237.9 | 3% | 0.27 | Fisher | ||||
| 2008 | Virginia Tech | 2.85 | 2% | 214.2 | 221.0 | 3% | 0.27 | Beamer | ||||
| 2006 | Pittsburgh | 2.61 | -6% | 206.3 | 212.5 | 3% | 0.25 | Wannstedt | ||||
| 2010 | South Florida | 2.66 | -5% | 207.8 | 213.8 | 3% | 0.25 | S. Holtz | ||||
| 2007 | USC | 4.20 | 51% | 258.7 | 266.2 | 3% | 0.24 | Carroll | ||||
| 2008 | Ohio State | 3.74 | 34% | 243.3 | 250.3 | 3% | 0.24 | Tressel | ||||
| 2009 | Michigan State | 2.58 | -8% | 205.0 | 210.9 | 3% | 0.24 | Dantonio | ||||
| 2012 | Michigan | 3.40 | 22% | 232.1 | 238.7 | 3% | 0.24 | Hoke | ||||
| 2011 | Connecticut | 2.35 | -16% | 197.5 | 202.7 | 3% | 0.22 | Pasqualoni | ||||
| 2012 | Arizona State | 2.80 | 1% | 212.5 | 218.1 | 3% | 0.22 | Graham | ||||
| 2007 | UCLA | 3.15 | 13% | 223.9 | 229.5 | 2% | 0.21 | Dorrell | ||||
| 2012 | Rutgers | 2.85 | 2% | 214.0 | 219.3 | 2% | 0.21 | Flood | ||||
| 2009 | Oklahoma State | 2.97 | 7% | 218.0 | 223.3 | 2% | 0.21 | Gundy | ||||
| 2009 | Stanford | 2.99 | 7% | 218.5 | 223.8 | 2% | 0.20 | Harbaugh | ||||
| 2011 | Georgia | 3.64 | 31% | 240.1 | 245.5 | 2% | 0.19 | Richt | ||||
| 2010 | Oregon State | 2.49 | -11% | 202.3 | 206.7 | 2% | 0.18 | Riley | ||||
| 2011 | Nebraska | 3.07 | 10% | 221.2 | 226.0 | 2% | 0.18 | Pellini | ||||
| 2009 | Arizona | 3.00 | 8% | 219.1 | 223.4 | 2% | 0.17 | M. Stoops | ||||
| 2007 | South Carolina | 2.87 | 3% | 214.8 | 219.0 | 2% | 0.16 | Spurrier | ||||
| 2006 | Oklahoma | 3.48 | 25% | 234.9 | 239.4 | 2% | 0.16 | B. Stoops | ||||
| 2007 | Oklahoma State | 2.78 | 0% | 211.8 | 215.8 | 2% | 0.16 | Gundy | ||||
| 2012 | Ohio State | 3.68 | 32% | 241.5 | 245.9 | 2% | 0.15 | Meyer | ||||
| 2010 | Kansas State | 2.36 | -15% | 198.0 | 201.5 | 2% | 0.15 | Snyder | ||||
| 2009 | Kansas | 2.53 | -9% | 203.5 | 206.9 | 2% | 0.14 | Mangino | ||||
| 2007 | Tennessee | 3.41 | 23% | 232.6 | 236.5 | 2% | 0.14 | Fulmer | ||||
| 2006 | Oregon | 2.68 | -4% | 208.3 | 211.8 | 2% | 0.14 | Bellotti | ||||
| 2008 | Arizona | 3.18 | 14% | 225.0 | 228.7 | 2% | 0.14 | M. Stoops | ||||
| 2008 | Clemson | 3.16 | 13% | 224.3 | 227.8 | 2% | 0.13 | Swinney | ||||
| 2006 | Texas Tech | 2.77 | 0% | 211.5 | 214.6 | 1% | 0.12 | Leach | ||||
| 2010 | Pittsburgh | 3.27 | 17% | 227.8 | 231.0 | 1% | 0.12 | Wannstedt | ||||
| 2006 | Arizona State | 2.73 | -2% | 210.1 | 213.0 | 1% | 0.12 | Koetter | ||||
| 2006 | Alabama | 2.77 | 0% | 211.5 | 214.5 | 1% | 0.12 | Shula | ||||
| 2011 | Iowa | 2.66 | -5% | 207.8 | 210.6 | 1% | 0.11 | Ferentz | ||||
| 2006 | USC | 3.98 | 43% | 251.3 | 254.6 | 1% | 0.11 | Carroll | ||||
| 2007 | Alabama | 2.96 | 6% | 217.6 | 220.4 | 1% | 0.11 | Saban | ||||
| 2007 | Arizona | 2.97 | 6% | 217.9 | 220.5 | 1% | 0.10 | M. Stoops | ||||
| 2011 | Louisville | 2.68 | -4% | 208.3 | 210.7 | 1% | 0.10 | Strong | ||||
| 2010 | Louisville | 2.70 | -3% | 209.0 | 211.4 | 1% | 0.09 | Strong | ||||
| 2010 | Miami-FL | 3.36 | 21% | 231.0 | 233.5 | 1% | 0.09 | Shannon | ||||
| 2008 | Georgia Tech | 2.84 | 2% | 213.7 | 215.7 | 1% | 0.08 | P. Johnson | ||||
| 2010 | LSU | 3.63 | 30% | 239.9 | 242.0 | 1% | 0.08 | Miles | ||||
| 2007 | Indiana | 2.13 | -24% | 190.3 | 192.0 | 1% | 0.08 | Lynch | ||||
| 2006 | Texas A&M | 2.99 | 7% | 218.7 | 220.6 | 1% | 0.07 | Franchione | ||||
| 2007 | Virginia | 2.78 | 0% | 211.6 | 213.5 | 1% | 0.07 | Groh | ||||
| 2007 | California | 3.23 | 16% | 226.5 | 228.4 | 1% | 0.07 | Tedford | ||||
| 2012 | Penn State | 3.27 | 18% | 228.0 | 229.9 | 1% | 0.07 | O'Brien | ||||
| 2010 | Connecticut | 2.29 | -18% | 195.7 | 197.2 | 1% | 0.06 | Edsall | ||||
| 2007 | Maryland | 2.72 | -3% | 209.6 | 211.0 | 1% | 0.05 | Friedgen | ||||
| 2009 | Miami-FL | 3.46 | 24% | 234.1 | 235.6 | 1% | 0.05 | Shannon | ||||
| 2011 | USC | 3.83 | 37% | 246.3 | 247.4 | 0% | 0.04 | Kiffen | ||||
| 2012 | Connecticut | 2.40 | -14% | 199.2 | 199.9 | 0% | 0.03 | Pasqualoni | ||||
| 2012 | Ole Miss | 2.98 | 7% | 218.5 | 219.3 | 0% | 0.03 | Freeze | ||||
| 2006 | Washington State | 2.55 | -8% | 204.3 | 205.0 | 0% | 0.03 | Doba | ||||
| 2009 | North Carolina | 3.09 | 11% | 221.8 | 222.3 | 0% | 0.02 | B. Davis | ||||
| 2010 | Arizona | 2.86 | 3% | 214.3 | 214.7 | 0% | 0.02 | M. Stoops | ||||
| 2009 | Kentucky | 2.54 | -9% | 203.8 | 204.2 | 0% | 0.01 | Brooks | ||||
| 2007 | Kansas State | 2.40 | -14% | 199.4 | 199.7 | 0% | 0.01 | Prince | ||||
| 2009 | Tennessee | 3.30 | 18% | 228.8 | 229.1 | 0% | 0.01 | Kiffen | ||||
| 2006 | UCLA | 2.88 | 4% | 215.2 | 215.1 | 0% | (0.00) | Dorrell | ||||
| 2010 | Clemson | 3.27 | 17% | 227.8 | 227.7 | 0% | (0.00) | Swinney | ||||
| 2012 | Virginia Tech | 2.89 | 4% | 215.3 | 215.1 | 0% | (0.00) | Beamer | ||||
| 2007 | Penn State | 3.25 | 17% | 227.1 | 226.8 | 0% | (0.01) | Paterno | ||||
| 2010 | Boston College | 2.58 | -7% | 205.1 | 204.7 | 0% | (0.02) | Spaziani | ||||
| 2009 | West Virginia | 2.80 | 1% | 212.5 | 212.0 | 0% | (0.02) | Stewart | ||||
| 2007 | Vanderbilt | 2.18 | -22% | 192.0 | 191.6 | 0% | (0.02) | Bo. Johnson | ||||
| 2011 | Miami-FL | 3.08 | 11% | 221.8 | 221.0 | 0% | (0.03) | Golden | ||||
| 2007 | Georgia Tech | 2.72 | -2% | 209.7 | 209.0 | 0% | (0.03) | Gailey | ||||
| 2007 | Washington | 2.73 | -2% | 210.2 | 209.5 | 0% | (0.03) | Willingham | ||||
| 2006 | Connecticut | 1.88 | -32% | 182.2 | 181.5 | 0% | (0.03) | Edsall | ||||
| 2010 | Kentucky | 2.55 | -8% | 204.3 | 203.5 | 0% | (0.03) | Phillips | ||||
| 2009 | South Carolina | 3.05 | 9% | 220.6 | 219.5 | -1% | (0.04) | Spurrier | ||||
| 2010 | Notre Dame | 3.60 | 29% | 238.9 | 237.6 | -1% | (0.04) | B. Kelly | ||||
| 2009 | Missouri | 2.66 | -4% | 207.8 | 206.5 | -1% | (0.05) | Pinkel | ||||
| 2011 | Georgia Tech | 2.90 | 4% | 215.6 | 213.5 | -1% | (0.08) | P. Johnson | ||||
| 2010 | Syracuse | 2.34 | -16% | 197.2 | 195.2 | -1% | (0.08) | Marrone | ||||
| 2008 | Wisconsin | 2.71 | -3% | 209.6 | 207.4 | -1% | (0.09) | Bielema | ||||
| 2008 | NC State | 2.67 | -4% | 208.1 | 205.9 | -1% | (0.09) | O'Brien | ||||
| 2012 | Texas Tech | 2.91 | 5% | 216.2 | 213.8 | -1% | (0.09) | Tuberville | ||||
| 2008 | Florida State | 3.38 | 21% | 231.4 | 228.8 | -1% | (0.09) | B. Bowden | ||||
| 2007 | Colorado | 2.55 | -9% | 204.1 | 201.6 | -1% | (0.10) | Hawkins | ||||
| 2012 | West Virginia | 2.90 | 4% | 215.8 | 213.2 | -1% | (0.10) | Holgorsen | ||||
| 2011 | Iowa State | 2.28 | -18% | 195.4 | 192.9 | -1% | (0.11) | Rhoads | ||||
| 2008 | California | 3.34 | 20% | 230.3 | 227.1 | -1% | (0.12) | Tedford | ||||
| 2006 | Texas | 3.52 | 26% | 236.2 | 232.8 | -1% | (0.12) | Brown | ||||
| 2008 | Maryland | 2.69 | -3% | 208.8 | 205.9 | -1% | (0.12) | Friedgen | ||||
| 2012 | UCLA | 3.20 | 15% | 225.7 | 222.4 | -1% | (0.12) | Mora | ||||
| 2012 | Georgia Tech | 2.89 | 4% | 215.4 | 212.3 | -1% | (0.12) | P. Johnson | ||||
| 2006 | Iowa | 2.72 | -2% | 209.7 | 206.5 | -2% | (0.13) | Ferentz | ||||
| 2006 | Notre Dame | 3.34 | 20% | 230.1 | 226.2 | -2% | (0.14) | Weis | ||||
| 2008 | Baylor | 2.35 | -16% | 197.6 | 193.8 | -2% | (0.16) | Briles | ||||
| 2007 | Texas | 3.65 | 31% | 240.4 | 235.5 | -2% | (0.17) | Brown | ||||
| 2011 | Mississippi State | 2.83 | 1% | 213.3 | 208.8 | -2% | (0.17) | Mullen | ||||
| 2006 | Georgia | 3.47 | 25% | 234.4 | 229.6 | -2% | (0.17) | Richt | ||||
| 2007 | Purdue | 2.59 | -7% | 205.4 | 201.0 | -2% | (0.18) | Tiller | ||||
| 2006 | Maryland | 2.75 | -1% | 210.9 | 206.2 | -2% | (0.19) | Friedgen | ||||
| 2006 | Penn State | 3.13 | 12% | 223.2 | 218.2 | -2% | (0.19) | Paterno | ||||
| 2011 | Syracuse | 2.36 | -15% | 197.9 | 193.4 | -2% | (0.19) | Marrone | ||||
| 2009 | Auburn | 3.18 | 14% | 224.8 | 219.6 | -2% | (0.19) | Chizik | ||||
| 2011 | Arizona State | 2.92 | 5% | 216.4 | 211.3 | -2% | (0.20) | Erickson | ||||
| 2011 | Wake Forest | 2.49 | -11% | 202.2 | 197.3 | -2% | (0.20) | Grobe | ||||
| 2009 | South Florida | 2.60 | -7% | 205.9 | 200.8 | -2% | (0.21) | Leavitt | ||||
| 2008 | South Carolina | 2.97 | 7% | 218.1 | 212.7 | -2% | (0.21) | Spurrier | ||||
| 2007 | Pittsburgh | 2.85 | 2% | 214.2 | 208.8 | -3% | (0.21) | Wannstedt | ||||
| 2011 | Northwestern | 2.58 | -7% | 205.2 | 199.8 | -3% | (0.22) | Fitzgerald | ||||
| 2011 | Illinois | 2.71 | -3% | 209.6 | 204.0 | -3% | (0.22) | Zook | ||||
| 2008 | Nebraska | 3.15 | 13% | 223.8 | 217.3 | -3% | (0.24) | Pellini | ||||
| 2008 | Illinois | 2.86 | 3% | 214.5 | 208.2 | -3% | (0.25) | Zook | ||||
| 2011 | Virginia | 2.62 | -6% | 206.6 | 200.5 | -3% | (0.25) | London | ||||
| 2010 | Arizona State | 3.00 | 8% | 219.0 | 212.3 | -3% | (0.26) | Erickson | ||||
| 2006 | Northwestern | 2.18 | -22% | 191.9 | 185.9 | -3% | (0.26) | Fitzgerald | ||||
| 2012 | North Carolina | 3.06 | 10% | 220.9 | 213.6 | -3% | (0.28) | Fedora | ||||
| 2012 | Pittsburgh | 3.03 | 9% | 219.9 | 212.1 | -4% | (0.30) | Chryst | ||||
| 2011 | Clemson | 3.29 | 18% | 228.7 | 220.5 | -4% | (0.30) | Swinney | ||||
| 2006 | Syracuse | 2.21 | -21% | 192.8 | 185.6 | -4% | (0.31) | Robinson | ||||
| 2008 | Georgia | 3.64 | 31% | 240.1 | 231.1 | -4% | (0.32) | Richt | ||||
| 2011 | Utah | 2.74 | -2% | 210.6 | 202.5 | -4% | (0.32) | Whittingham | ||||
| 2012 | NC State | 2.67 | -4% | 208.0 | 199.5 | -4% | (0.34) | O'Brien | ||||
| 2006 | Kansas State | 2.63 | -6% | 206.7 | 198.2 | -4% | (0.34) | Prince | ||||
| 2009 | Rutgers | 2.67 | -4% | 208.2 | 199.4 | -4% | (0.36) | Schiano | ||||
| 2009 | Florida State | 3.28 | 18% | 228.2 | 217.9 | -4% | (0.38) | B. Bowden | ||||
| 2007 | Washington State | 2.58 | -7% | 205.3 | 196.0 | -5% | (0.38) | Doba | ||||
| 2010 | Texas Tech | 2.77 | -1% | 211.3 | 201.4 | -5% | (0.39) | Tuberville | ||||
| 2008 | Virginia | 2.66 | -4% | 207.9 | 198.0 | -5% | (0.40) | Groh | ||||
| 2009 | Mississippi State | 2.79 | 0% | 212.1 | 202.0 | -5% | (0.40) | Mullen | ||||
| 2007 | Michigan | 3.60 | 29% | 238.8 | 227.3 | -5% | (0.40) | Carr | ||||
| 2008 | Kentucky | 2.39 | -14% | 199.0 | 189.4 | -5% | (0.41) | Brooks | ||||
| 2009 | Iowa State | 2.22 | -20% | 193.4 | 183.8 | -5% | (0.42) | Rhoads | ||||
| 2008 | LSU | 3.63 | 30% | 239.7 | 227.8 | -5% | (0.42) | Miles | ||||
| 2011 | NC State | 2.76 | -1% | 211.0 | 200.5 | -5% | (0.42) | O'Brien | ||||
| 2011 | Penn State | 3.42 | 23% | 232.9 | 221.1 | -5% | (0.43) | Paterno/Bradley | ||||
| 2010 | Baylor | 2.51 | -10% | 202.9 | 192.6 | -5% | (0.43) | Briles | ||||
| 2010 | North Carolina | 3.20 | 15% | 225.6 | 214.0 | -5% | (0.43) | B. Davis | ||||
| 2009 | Notre Dame | 3.71 | 33% | 242.5 | 230.0 | -5% | (0.43) | Weis | ||||
| 2006 | Colorado | 2.58 | -8% | 205.0 | 194.4 | -5% | (0.44) | Hawkins | ||||
| 2006 | Arizona | 2.84 | 2% | 213.9 | 202.6 | -5% | (0.44) | M. Stoops | ||||
| 2011 | Pittsburgh | 3.09 | 11% | 222.0 | 210.1 | -5% | (0.45) | Graham | ||||
| 2009 | LSU | 3.65 | 31% | 240.5 | 227.5 | -5% | (0.46) | Miles | ||||
| 2006 | Indiana | 2.09 | -25% | 188.9 | 178.4 | -6% | (0.47) | Hoeppner | ||||
| 2009 | Duke | 2.45 | -12% | 200.9 | 189.5 | -6% | (0.48) | Cutcliffe | ||||
| 2012 | Washington | 2.92 | 5% | 216.3 | 203.5 | -6% | (0.50) | Sarkisian | ||||
| 2011 | North Carolina | 3.19 | 15% | 225.3 | 211.8 | -6% | (0.50) | Withers | ||||
| 2012 | Temple | 2.16 | -22% | 191.4 | 179.9 | -6% | (0.50) | Addazio | ||||
| 2009 | Kansas State | 2.40 | -14% | 199.2 | 187.1 | -6% | (0.51) | Snyder | ||||
| 2006 | Florida State | 3.40 | 22% | 232.3 | 218.0 | -6% | (0.52) | B. Bowden | ||||
| 2006 | Washington | 2.75 | -1% | 210.6 | 197.5 | -6% | (0.52) | Willingham | ||||
| 2012 | Texas | 3.85 | 38% | 247.0 | 231.2 | -6% | (0.53) | Brown | ||||
| 2011 | California | 3.24 | 16% | 227.0 | 212.4 | -6% | (0.54) | Tedford | ||||
| 2009 | Vanderbilt | 2.25 | -19% | 194.3 | 181.7 | -6% | (0.55) | Bo. Johnson | ||||
| 2010 | Georgia | 3.60 | 29% | 238.9 | 223.2 | -7% | (0.55) | Richt | ||||
| 2006 | Mississippi State | 2.37 | -15% | 198.2 | 185.2 | -7% | (0.55) | Croom | ||||
| 2008 | Minnesota | 2.46 | -12% | 201.2 | 187.7 | -7% | (0.56) | Brewster | ||||
| 2012 | Arkansas | 2.89 | 4% | 215.3 | 200.8 | -7% | (0.56) | J.L. Smith | ||||
| 2011 | Texas | 3.82 | 37% | 246.0 | 229.5 | -7% | (0.56) | Brown | ||||
| 2008 | Stanford | 2.85 | 2% | 214.2 | 199.7 | -7% | (0.57) | Harbaugh | ||||
| 2008 | Purdue | 2.55 | -9% | 204.1 | 190.2 | -7% | (0.57) | Tiller | ||||
| 2006 | Michigan State | 2.46 | -12% | 201.2 | 187.5 | -7% | (0.57) | J.L. Smith | ||||
| 2010 | Northwestern | 2.45 | -12% | 201.0 | 187.2 | -7% | (0.58) | Fitzgerald | ||||
| 2009 | NC State | 2.61 | -6% | 206.0 | 191.8 | -7% | (0.58) | O'Brien | ||||
| 2009 | Texas A&M | 3.21 | 15% | 226.0 | 210.2 | -7% | (0.59) | Sherman | ||||
| 2006 | Illinois | 2.56 | -8% | 204.5 | 190.1 | -7% | (0.59) | Zook | ||||
| 2009 | Minnesota | 2.57 | -8% | 205.0 | 190.5 | -7% | (0.59) | Brewster | ||||
| 2010 | Iowa State | 2.22 | -20% | 193.2 | 179.4 | -7% | (0.60) | Rhoads | ||||
| 2007 | NC State | 2.68 | -4% | 208.6 | 193.7 | -7% | (0.60) | O'Brien | ||||
| 2012 | USC | 3.82 | 37% | 246.0 | 228.4 | -7% | (0.60) | Kiffen | ||||
| 2009 | Virginia | 2.49 | -11% | 202.3 | 187.7 | -7% | (0.61) | Groh | ||||
| 2006 | Baylor | 2.21 | -21% | 193.1 | 179.1 | -7% | (0.61) | Morriss | ||||
| 2009 | Arizona State | 2.98 | 7% | 218.3 | 202.2 | -7% | (0.62) | Erickson | ||||
| 2012 | Missouri | 2.96 | 6% | 217.6 | 201.4 | -7% | (0.62) | Pinkel | ||||
| 2007 | North Carolina | 2.76 | -1% | 211.0 | 195.2 | -7% | (0.63) | B. Davis | ||||
| 2006 | Purdue | 2.66 | -5% | 207.7 | 192.1 | -8% | (0.63) | Tiller | ||||
| 2012 | Mississippi State | 2.91 | 5% | 216.2 | 199.8 | -8% | (0.63) | Mullen | ||||
| 2006 | Virginia | 2.77 | 0% | 211.5 | 195.6 | -8% | (0.63) | Groh | ||||
| 2012 | Indiana | 2.50 | -10% | 202.6 | 187.1 | -8% | (0.64) | Wilson | ||||
| 2008 | Duke | 2.50 | -10% | 202.6 | 187.0 | -8% | (0.65) | Cutcliffe | ||||
| 2007 | Stanford | 2.71 | -3% | 209.6 | 193.3 | -8% | (0.65) | Harbaugh | ||||
| 2012 | Utah | 2.70 | -3% | 209.1 | 192.5 | -8% | (0.67) | Whittingham | ||||
| 2012 | Purdue | 2.51 | -10% | 202.9 | 186.2 | -8% | (0.69) | Hope | ||||
| 2010 | Duke | 2.43 | -13% | 200.1 | 183.5 | -8% | (0.70) | Cutcliffe | ||||
| 2009 | Washington | 2.84 | 2% | 213.7 | 195.9 | -8% | (0.70) | Sarkisian | ||||
| 2007 | Florida State | 3.37 | 21% | 231.1 | 211.8 | -8% | (0.70) | B. Bowden | ||||
| 2012 | Minnesota | 2.49 | -11% | 202.2 | 185.1 | -8% | (0.71) | Kill | ||||
| 2009 | Georgia | 3.64 | 31% | 240.2 | 219.6 | -9% | (0.72) | Richt | ||||
| 2011 | Duke | 2.49 | -11% | 202.3 | 184.7 | -9% | (0.73) | Cutcliffe | ||||
| 2011 | Purdue | 2.49 | -11% | 202.1 | 184.5 | -9% | (0.73) | Hope | ||||
| 2010 | Ole Miss | 3.01 | 8% | 219.3 | 200.0 | -9% | (0.74) | Nutt | ||||
| 2007 | Northwestern | 2.26 | -19% | 194.5 | 177.3 | -9% | (0.74) | Fitzgerald | ||||
| 2011 | Boston College | 2.59 | -7% | 205.6 | 187.3 | -9% | (0.75) | Spaziani | ||||
| 2006 | NC State | 2.82 | 1% | 213.0 | 193.9 | -9% | (0.76) | Amato | ||||
| 2008 | Arkansas | 2.72 | -3% | 209.6 | 190.5 | -9% | (0.77) | Petrino | ||||
| 2009 | Syracuse | 2.35 | -16% | 197.5 | 179.5 | -9% | (0.77) | Marrone | ||||
| 2012 | Duke | 2.49 | -11% | 202.1 | 183.4 | -9% | (0.78) | Cutcliffe | ||||
| 2010 | Indiana | 2.35 | -16% | 197.6 | 179.3 | -9% | (0.78) | Lynch | ||||
| 2011 | Tennessee | 3.23 | 16% | 226.5 | 205.4 | -9% | (0.78) | Dooley | ||||
| 2006 | Miami-FL | 3.50 | 26% | 235.5 | 213.5 | -9% | (0.79) | Coker | ||||
| 2010 | Colorado | 2.74 | -2% | 210.6 | 190.6 | -9% | (0.80) | Hawkins | ||||
| 2007 | Iowa | 2.78 | 0% | 211.8 | 191.7 | -9% | (0.80) | Ferentz | ||||
| 2006 | Iowa State | 2.21 | -21% | 193.1 | 174.6 | -10% | (0.80) | McCarney | ||||
| 2011 | Florida | 3.71 | 33% | 242.5 | 219.0 | -10% | (0.81) | Muschamp | ||||
| 2012 | Iowa | 2.68 | -4% | 208.6 | 188.1 | -10% | (0.82) | Ferentz | ||||
| 2011 | Ohio State | 3.72 | 33% | 242.7 | 218.7 | -10% | (0.83) | Fickell | ||||
| 2012 | South Florida | 2.68 | -4% | 208.5 | 187.6 | -10% | (0.84) | S. Holtz | ||||
| 2007 | Texas A&M | 2.99 | 7% | 218.7 | 196.6 | -10% | (0.85) | Franchione | ||||
| 2009 | Indiana | 2.28 | -18% | 195.2 | 175.3 | -10% | (0.85) | Lynch | ||||
| 2011 | Washington | 2.98 | 7% | 218.2 | 195.6 | -10% | (0.87) | Sarkisian | ||||
| 2006 | Ole Miss | 2.68 | -4% | 208.3 | 186.7 | -10% | (0.87) | Orgeron | ||||
| 2010 | Washington | 2.93 | 5% | 216.7 | 194.0 | -10% | (0.88) | Sarkisian | ||||
| 2010 | Virginia | 2.56 | -8% | 204.5 | 182.9 | -11% | (0.89) | London | ||||
| 2012 | Miami-FL | 3.05 | 10% | 220.8 | 197.3 | -11% | (0.89) | Golden | ||||
| 2010 | Georgia Tech | 3.05 | 10% | 220.7 | 196.5 | -11% | (0.92) | P. Johnson | ||||
| 2009 | USC | 4.09 | 47% | 254.8 | 226.8 | -11% | (0.92) | Carroll | ||||
| 2010 | Purdue | 2.43 | -13% | 200.3 | 178.1 | -11% | (0.93) | Hope | ||||
| 2009 | California | 3.24 | 16% | 226.9 | 201.5 | -11% | (0.94) | Tedford | ||||
| 2008 | Kansas State | 2.51 | -10% | 202.7 | 179.6 | -11% | (0.96) | Prince | ||||
| 2008 | Tennessee | 3.34 | 20% | 230.1 | 203.8 | -11% | (0.96) | Fulmer | ||||
| 2008 | Indiana | 2.19 | -21% | 192.4 | 170.2 | -12% | (0.96) | Lynch | ||||
| 2010 | Florida | 3.90 | 40% | 248.7 | 219.6 | -12% | (0.98) | Meyer | ||||
| 2012 | Tennessee | 3.28 | 18% | 228.3 | 201.6 | -12% | (0.98) | Dooley | ||||
| 2007 | Minnesota | 2.28 | -18% | 195.3 | 171.9 | -12% | (1.00) | Brewster | ||||
| 2008 | Arizona State | 2.97 | 6% | 217.9 | 191.8 | -12% | (1.00) | Erickson | ||||
| 2010 | Tennessee | 3.30 | 18% | 228.9 | 201.4 | -12% | (1.01) | Dooley | ||||
| 2011 | Arizona | 2.70 | -3% | 209.2 | 183.6 | -12% | (1.03) | M. Stoops | ||||
| 2010 | Penn State | 3.46 | 24% | 234.3 | 205.0 | -12% | (1.05) | Paterno | ||||
| 2007 | Iowa State | 2.21 | -21% | 193.1 | 168.9 | -13% | (1.05) | Chizik | ||||
| 2010 | Michigan | 3.50 | 26% | 235.5 | 205.9 | -13% | (1.05) | Rodriguez | ||||
| 2007 | Nebraska | 3.00 | 8% | 218.9 | 191.4 | -13% | (1.05) | Callahan | ||||
| 2010 | Minnesota | 2.58 | -7% | 205.2 | 179.2 | -13% | (1.06) | Brewster | ||||
| 2009 | Baylor | 2.42 | -13% | 200.0 | 174.3 | -13% | (1.08) | Briles | ||||
| 2009 | Maryland | 2.74 | -2% | 210.3 | 182.8 | -13% | (1.10) | Friedgen | ||||
| 2008 | Syracuse | 2.40 | -14% | 199.3 | 173.1 | -13% | (1.10) | Robinson | ||||
| 2008 | Auburn | 3.17 | 14% | 224.6 | 195.0 | -13% | (1.11) | Tuberville | ||||
| 2011 | Oregon State | 2.54 | -9% | 204.0 | 176.9 | -13% | (1.11) | Riley | ||||
| 2012 | Virginia | 2.74 | -2% | 210.4 | 182.3 | -13% | (1.12) | London | ||||
| 2012 | Boston College | 2.59 | -7% | 205.6 | 177.9 | -13% | (1.13) | Spaziani | ||||
| 2008 | Notre Dame | 3.64 | 31% | 240.1 | 207.5 | -14% | (1.14) | Weis | ||||
| 2011 | Auburn | 3.29 | 18% | 228.4 | 197.3 | -14% | (1.14) | Chizik | ||||
| 2009 | UCLA | 3.44 | 24% | 233.6 | 201.5 | -14% | (1.15) | Neuheisel | ||||
| 2008 | Iowa State | 2.31 | -17% | 196.3 | 169.3 | -14% | (1.15) | Chizik | ||||
| 2009 | Colorado | 2.76 | -1% | 211.1 | 181.6 | -14% | (1.17) | Hawkins | ||||
| 2007 | Ole Miss | 2.82 | 1% | 213.0 | 182.2 | -14% | (1.21) | Orgeron | ||||
| 2011 | Washington State | 2.51 | -10% | 203.0 | 173.4 | -15% | (1.22) | Wulff | ||||
| 2008 | Miami-FL | 3.56 | 28% | 237.3 | 202.7 | -15% | (1.22) | Shannon | ||||
| 2010 | Rutgers | 2.74 | -2% | 210.4 | 179.6 | -15% | (1.23) | Schiano | ||||
| 2010 | USC | 4.08 | 46% | 254.6 | 217.1 | -15% | (1.24) | Kiffen | ||||
| 2011 | Kentucky | 2.70 | -3% | 209.1 | 178.2 | -15% | (1.24) | Phillips | ||||
| 2010 | Vanderbilt | 2.33 | -16% | 197.0 | 167.5 | -15% | (1.26) | Caldwell | ||||
| 2011 | Texas Tech | 2.92 | 5% | 216.5 | 183.7 | -15% | (1.27) | Tuberville | ||||
| 2006 | North Carolina | 2.68 | -4% | 208.4 | 176.7 | -15% | (1.28) | Bunting | ||||
| 2009 | Michigan | 3.57 | 28% | 237.7 | 201.0 | -15% | (1.30) | Rodriguez | ||||
| 2012 | Maryland | 2.75 | -1% | 210.9 | 178.2 | -15% | (1.30) | Edsall | ||||
| 2006 | Duke | 2.33 | -17% | 196.8 | 163.8 | -17% | (1.41) | Roof | ||||
| 2008 | Louisville | 2.83 | 2% | 213.4 | 176.8 | -17% | (1.44) | Kragthorpe | ||||
| 2011 | Maryland | 2.75 | -1% | 210.8 | 174.1 | -17% | (1.46) | Edsall | ||||
| 2010 | Wake Forest | 2.43 | -13% | 200.3 | 165.4 | -17% | (1.46) | Grobe | ||||
| 2012 | California | 3.19 | 15% | 225.3 | 185.9 | -17% | (1.47) | Tedford | ||||
| 2011 | Minnesota | 2.61 | -6% | 206.1 | 169.5 | -18% | (1.49) | Kill | ||||
| 2007 | Duke | 2.37 | -15% | 198.3 | 162.2 | -18% | (1.53) | Roof | This got Ted Roof fired from Duke | |||
| 2012 | Wash State | 2.56 | -8% | 204.4 | 166.8 | -18% | (1.54) | Leach | Leach's first year in Pullman was nothing to write home about | |||
| 2008 | Mississippi State | 2.61 | -6% | 206.2 | 167.9 | -19% | (1.56) | Croom | This got Sylvester Croom fired | |||
| 2007 | Miami-FL | 3.56 | 28% | 237.5 | 193.0 | -19% | (1.57) | Shannon | Shannon's first year as HC of Hurricanes | |||
| 2009 | Louisville | 2.75 | -1% | 210.9 | 171.1 | -19% | (1.58) | Kragthorpe | This got Steve Kragthorpe fired | |||
| 2010 | California | 3.24 | 16% | 226.9 | 184.0 | -19% | (1.59) | Tedford | The year the slow decline of Cal's performance got serious | |||
| 2007 | Baylor | 2.18 | -22% | 191.9 | 154.9 | -19% | (1.62) | Morriss | This got Guy Morriss fired | |||
| 2008 | Colorado | 2.77 | -1% | 211.5 | 170.6 | -19% | (1.62) | Hawkins | Intramurals? | |||
| 2006 | Stanford | 2.65 | -5% | 207.5 | 167.0 | -19% | (1.64) | Harris | This got Walt Harris fired | |||
| 2009 | Illinois | 2.89 | 4% | 215.3 | 173.2 | -20% | (1.64) | Zook | Ron Zook's worst year of a tenure that wasn't great | |||
| 2007 | Syracuse | 2.27 | -18% | 195.0 | 156.9 | -20% | (1.64) | Robinson | Greg Robinson is a very good DC. His results as a HC weren't good | |||
| 2012 | Kansas | 2.56 | -8% | 204.6 | 164.0 | -20% | (1.67) | Weis | Decided schematic advantage? | |||
| 2010 | Texas | 3.81 | 37% | 245.8 | 196.2 | -20% | (1.69) | Brown | Things had to go very wrong for a team this talented to be so poor | |||
| 2012 | Wake Forest | 2.51 | -10% | 202.7 | 161.7 | -20% | (1.70) | Grobe | Things went steadily downhill for Grobe since 2009 | |||
| 2008 | Michigan | 3.63 | 30% | 239.7 | 188.5 | -21% | (1.79) | Rodriguez | Rich Rod's first year at Michigan. It didn't get much better for him there | |||
| 2011 | Indiana | 2.43 | -13% | 200.2 | 157.0 | -22% | (1.81) | Wilson | Wilson's first year in Bloomington | |||
| 2010 | Washington State | 2.58 | -7% | 205.1 | 159.9 | -22% | (1.85) | Wulff | Some improvement over first two years | |||
| 2012 | Illinois | 2.65 | -5% | 207.4 | 161.4 | -22% | (1.86) | Beckman | Beckman's first year at Illinois | |||
| 2011 | UCLA | 3.33 | 20% | 229.9 | 178.4 | -22% | (1.88) | Neuheisel | This (finally) got Neuheisel fired | |||
| 2010 | UCLA | 3.56 | 28% | 237.5 | 183.3 | -23% | (1.91) | Neuheisel | The consistency of failure here is breathtaking | |||
| 2008 | UCLA | 3.37 | 21% | 231.1 | 178.2 | -23% | (1.92) | Neuheisel | Neuheisel's first year in Westwood | |||
| 2011 | Ole Miss | 2.95 | 6% | 217.2 | 166.7 | -23% | (1.95) | Nutt | Looks like Nutt was mailing it in by this stage | |||
| 2012 | Kentucky | 2.75 | -1% | 210.8 | 158.1 | -25% | (2.10) | Phillips | This got Joker Phillips fired | |||
| 2010 | Kansas | 2.59 | -7% | 205.5 | 153.0 | -26% | (2.14) | Gill | Owen Gill's first year in Lawrence | |||
| 2011 | Colorado | 2.66 | -4% | 207.8 | 154.7 | -26% | (2.15) | Embree | John Embree's first year in Boulder | |||
| 2007 | Notre Dame | 3.39 | 22% | 231.7 | 172.2 | -26% | (2.16) | Weis | Decided schematic advantage? | |||
| 2011 | Kansas | 2.71 | -3% | 209.5 | 152.7 | -27% | (2.27) | Gill | Turner Gill's last year in Lawrence | |||
| 2008 | Texas A&M | 3.17 | 14% | 224.7 | 163.1 | -27% | (2.30) | Sherman | Sherman's first year in College Station | |||
| 2012 | Auburn | 3.47 | 25% | 234.5 | 162.9 | -31% | (2.56) | Chizik | Absolutely inexcusable | |||
| 2008 | Washington | 2.85 | 2% | 214.0 | 143.3 | -33% | (2.77) | Willingham | It takes a special effort to take average talent and go 0-12 | |||
| 2012 | Colorado | 2.57 | -8% | 204.7 | 128.0 | -37% | (3.14) | Embree | John Embree's last year in Boulder | |||
| 2008 | Washington State | 2.49 | -11% | 202.2 | 125.5 | -38% | (3.18) | Wulff | Wulff's first year in Pullman | |||
| 2009 | Washington State | 2.55 | -9% | 204.0 | 125.8 | -38% | (3.22) | Wulff | Pretty impressive that he got a 3rd (nevermind 4th) year | |||
| Full Sample Averages | 2.79 | 3.3% | 214.9 | 214.9 | 0.0% | |||||||
| Standard Deviation | 0.46 | 16.4% | 15.0 | 29.6 | 11.9% | |||||||
Loading comments...