-format(webp)/cdn.vox-cdn.com/uploads/chorus_image/image/11621883/20130104_kkt_aj6_222.0.jpg)
Last year the Football Study Hall team charted over 16,000 individual plays, 322 of which were attempts to convert on fourth down. Of those 322 plays, fewer than half (151) were pass attempts. Looking at all the data, I found four major trends jump out:
- Fourth down attempts were overwhelmingly the domain of the trailing team
- Field position played a large factor in determining when teams would attempt fourth down
- Passing on fourth down resulted in lower-than-average completion percentages
- Fourth down passing came primarily from the shotgun formation.
Our data showed the overwhelming majority of fourth downs, nearly 75 percent, were attempted by the trailing team. This makes sense as the trailing team has a greater urgency to score than its opponent. When charted to show the point difference between teams (see below), the data showed that not only were most teams trailing, but they were behind by more than a touchdown.
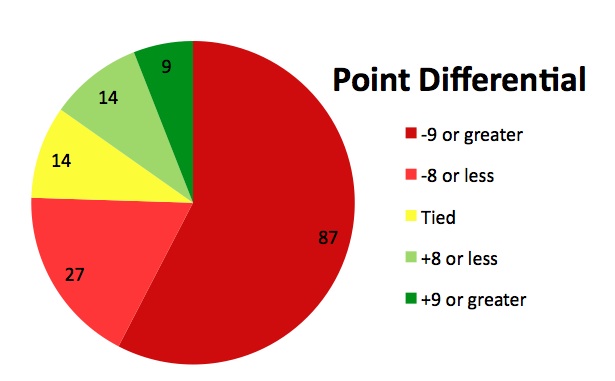
Why so many attempts from teams trailing by more than one score? I thought it was an attempt to score, recover an onside kick and score again during some late game heroics. However, the data did not support this; 64 of the 87 attempts by teams trailing by more than one score above (dark red) came from teams that were, in fact, down by more than two scores, meaning my original theory was incorrect. The only justification I have to explain the numbers is that these teams are already down by such insurmountable amounts that even a failed pass attempt, and the subsequent field position of their opponent, is no longer a sufficient disincentive. A friend described this as a form of on-field Prospect Theory (nerd alert), in that the trailing team is no longer inhibited by the fear of losing as it is all but assured. Instead, the trailing team is willing to accept losing by more points should their conversion fail with the understanding that if the conversion succeed they will still lose but by fewer points.
Consider Arkansas vs. Alabama on September 15. On two non-sequential drives against Alabama, Arkansas trailed by more than 30 points yet attempted to convert on fourth down. On their first attempt, the Razorbacks completed a 12-yard pass for a first down. However, by the time Arkansas attempted its second conversion, the Hogs were trailing by 52 points. In both cases, Arkansas was not worried about losing as it was all but guaranteed. Instead of trying to win, Arkansas merely played to lose by less, and we know how that game ended.
Next is field position. Were I to tell you the vast majority of the fourth downs attempted came in the opponent's half of the field, you probably wouldn’t be all that surprised. Seems like common knowledge that you wouldn’t risk giving your opponent the ball in your own half unless you absolutely had to, right? That said, I was still surprised to see that four of every five attempts charted took place in the offensive half. Below is a breakdown of fourth down attempts by field position:
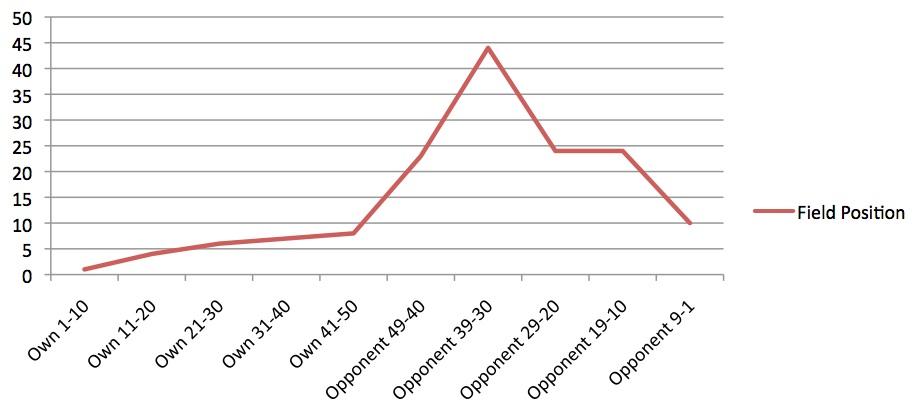
Within the offensive half, fourth down attempts were split nearly equally between the Red Zone and the rest of the half. Without time data we cannot determine whether teams needed to convert at higher rates within the Red Zone or if they merely felt that trying for six points was better than settling for three. Additionally, our sample showed a strikingly high number of fourth downs attempted in the offensive area outside of normal field goal range, leading me to believe that coaches determined the potential upside to converting on fourth down was higher than punting.
In the defensive half, desperation/late game heroics also played a large factor in determining when teams attempted fourth downs too. The trailing team attempted to convert on fourth down at a ratio of 3:1, and every fourth down that was attempted in the defensive half, at least in our data set, was done by teams playing from behind. Further still, of the 26 plays that were attempted in the defensive half, 23 of them were run in the fourth quarter, further supporting our desperation/late game heroics claim.
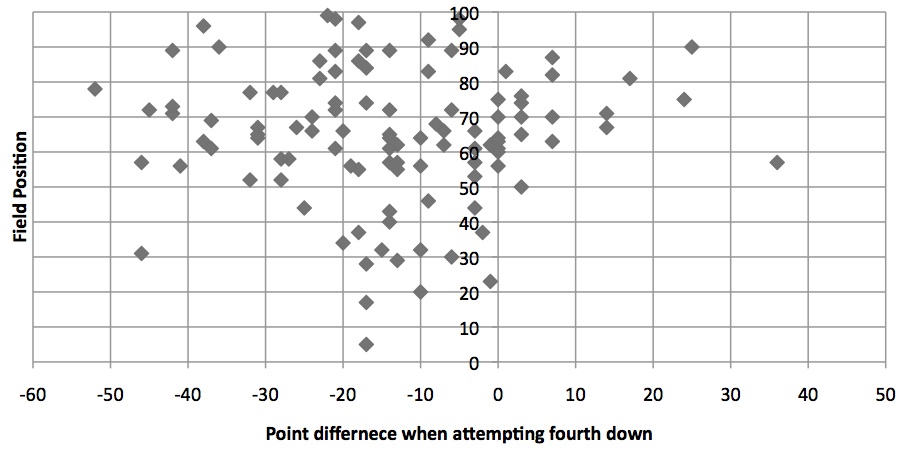
And just because we love charts so much, below is another plotting field position and point difference for each attempted fourth down conversion. When you overlay the attempted fourth downs with the field position, you see that the offenses willing to risk the most were almost entirely the ones down by no more than two touchdowns. In this chart, the vertical axis shows distance from own end zone (e.g. 99 is equal to opponent one yard line) while the horizontal axis shows how much the attempting team is winning or losing at the time:
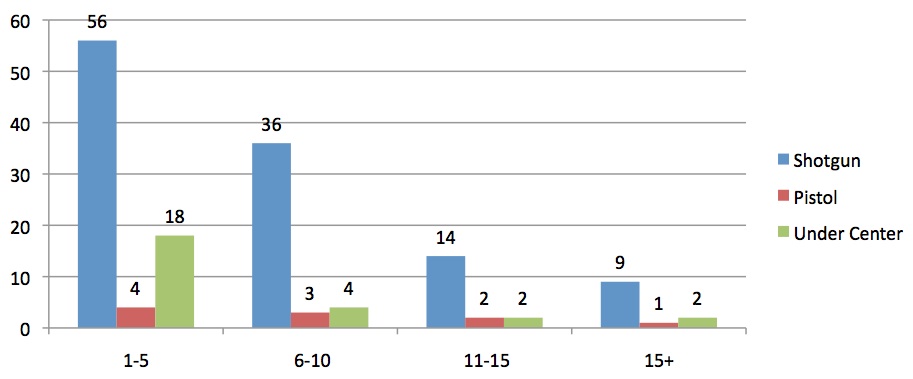
So now that we know what the scores and field positions looked like, just how successful were these offenses at converting on fourth down passes? The short answer is that, predictably, success varied greatly depending on distance, and below is a chart containing all fourth down pass-attempts broken out by distance.
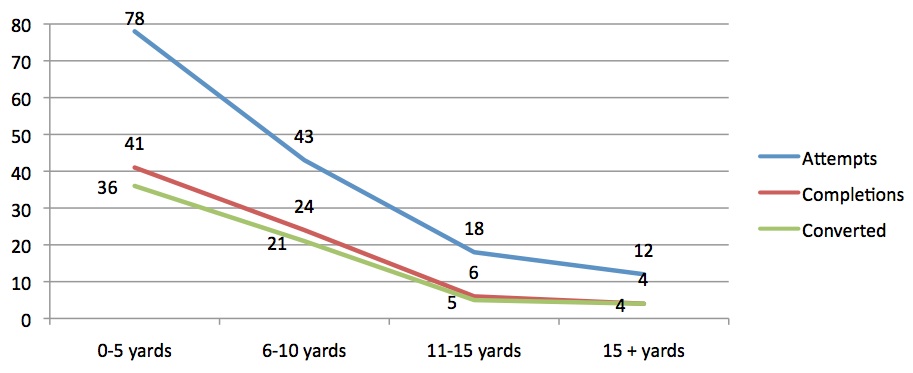
Not surprisingly, short yardage passing situations, where the threat of a run was conceivably high, resulted in a 20% higher completion percentage (54.5%) than fourth-and-long situations where the run was an unlikely option (33%). The dramatic drop in completion percentage on fourth-and-long can be attributed to a number of causes including defensive pressure, additional defensive backs and other factors, but surprisingly the number of fourth downs that were converted on longer plays actually increased. I don’t have any hard data to explain this trend, but it is likely that bubble screens, passes into the flat, and short crossing routes resulted in higher completion percentages but required receivers and available blockers to fight for the yardage necessary to move the chains. Whereas, in distances of greater than ten yards, less emphasis was placed on yards after the catch, and instead receivers needed only to reach the down marker before the ball was delivered.
The final, and probably most surprising, result our charted data revealed was the reliance upon the shotgun formation. This reliance wasn’t limited to your typical offenders: Air Raid offenses and half of the Big 12. Even teams known for running pro-style offenses, such as USC, Alabama, and Georgia, were relying upon the shotgun in fourth down situations. Of course, the shotgun makes sense as it gives the quarterback valuable time to read the defense, avoid pressure, and check down receivers; this is not a luxury afforded the QB who must complete a 3-step drop before throwing. In fact, a full 76% of all pass attempts came from the shotgun formation, and that number jumps to 82% if you include all passes on fourth down where the quarterback was not lined up under center.
We’re not all charts and graphs here though. In addition to crunching numbers, one of the side benefits of this job is that I get to look back on the 2012 season and see some of the interesting details that are typically overlooked. For example:
- Texas A&M was the only team to attempt to convert three fourth downs while winning by 9 or more
- Oregon was a close second, going for it three times while holding a lead of any size
- USC apparently spent a great deal of the year playing from behind. In our data sample alone, USC attempted to convert on fourth down 13 times in 2012. Of those 13, 9 happened while USC was behind. And those nine attempts came against six different opponents.
Example of Texas A&M going for it while up.
Example of incomplete pass on fourth and short.
So what do all these numbers and charts show us exactly? First, they show us some things we already knew. For example, teams trailing were attempting to throw on fourth down at a much higher rate than teams in the lead. Another pattern is that the riskiest fourth down attempts, those deep in the defensive half of the field, came from teams trailing by no more than two touchdowns.
The data also shows us some things that may be less obvious, such as the 50% success rate throwing on fourth-and-short. The data also shows a strong reliance on the shotgun to give the quarterback enough time to evade pressure in order to check down his receivers as they run routes. Lastly, it shows coaches are not afraid to go for it on fourth when they’re beyond field goal range but risk a touchback.
How was that? A self-professed USC fanatic, I only mentioned them twice and once was to dump on them for poor performance! Check back in a few weeks and we’ll run some of the same stats on fourth and the run.