The 2011 Alabama defense has been recognized as one of the most dominant in college football in recent memory. It was so strong it raises the question of how far back to we have to go to find another that punches in it's weight class.
According to ESPN's Brad Edwards, the 1986 Oklahoma Sooners are not only the only the team to finish first in rushing, passing & scoring defense, they are the only other one to do it since the NCAA started keeping records in 1937. That tidbit was interesting enough it set me off looking for those numbers to do some comparisons and was quickly disappointed.
It turns out that the NCAA statistics available online only go back to 2000. There is also an archive of statistics from 1989-1999 but these are only in PDF format and do not include bowl contests. I assume there are hard copies of these somewhere but until someone is kind enough to make them available we're stuck with what we've got.
So, to start, I went back and looked up the defensive numbers of the 1986 Oklahoma team and, sure enough, they exceed the 2011Alabama squad. Those Sooners allowed 6.75 points per game that season and 175.5 yards per game. That's likely the gold standard of the modern era.
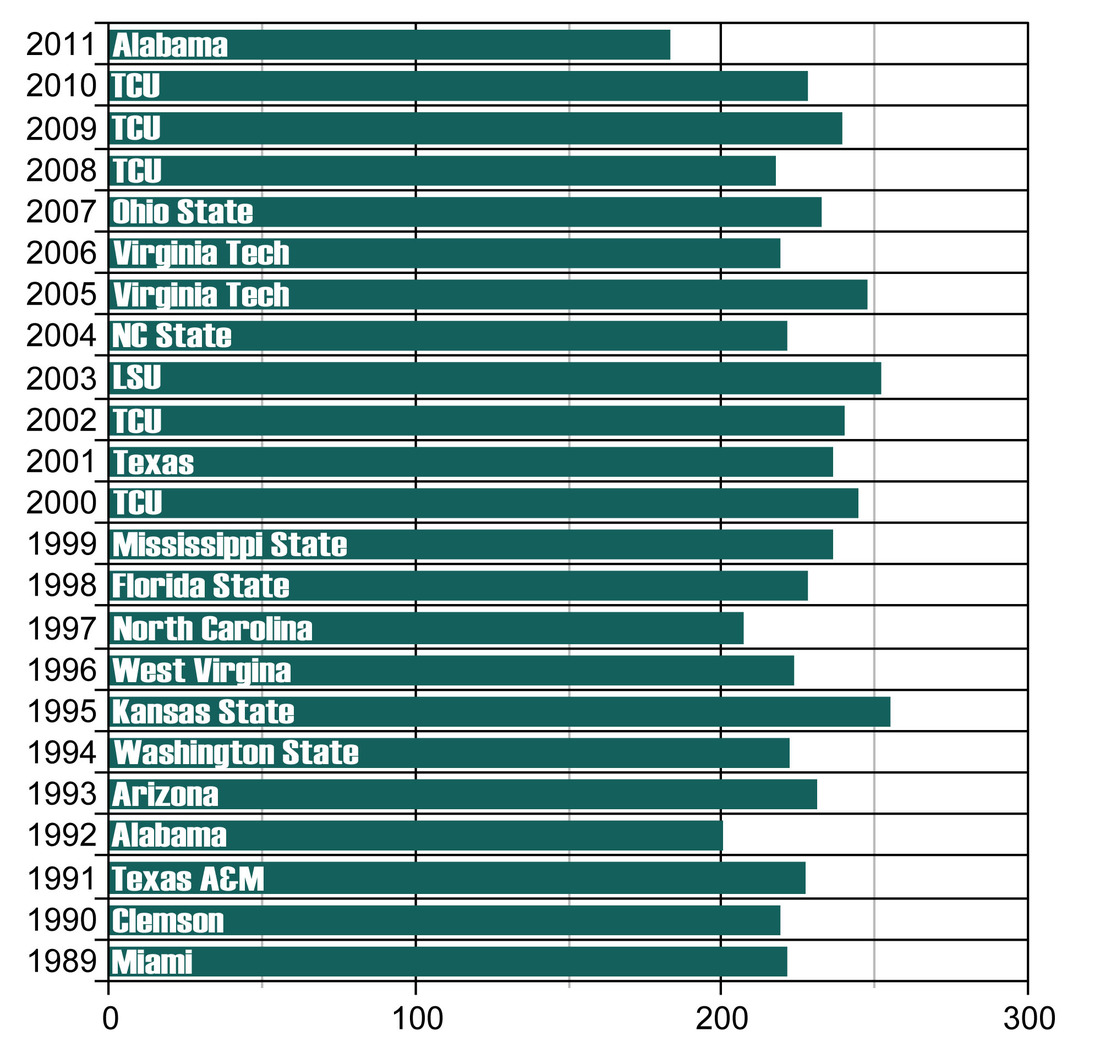
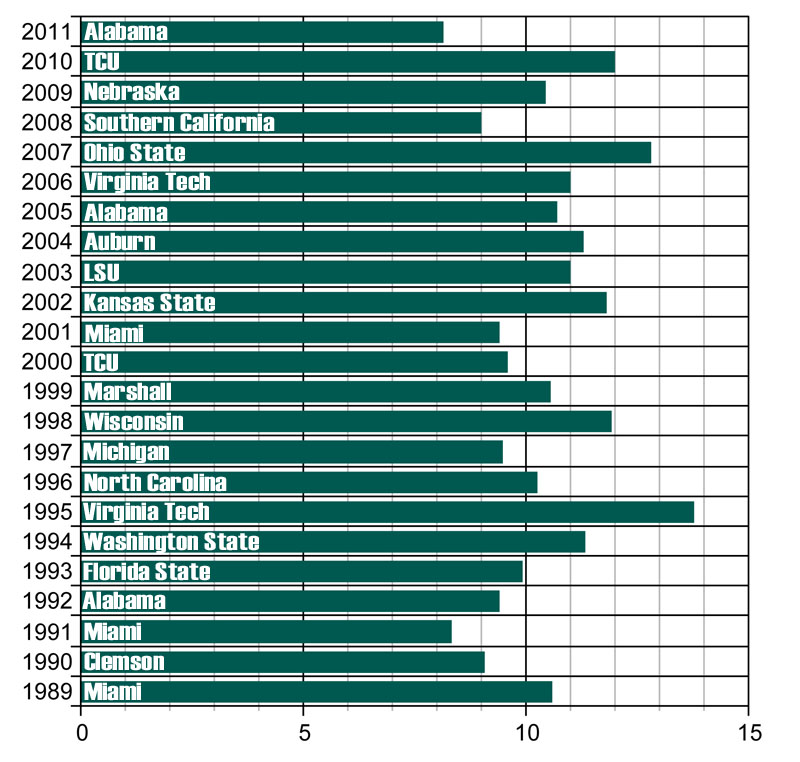
To get a year-by-year comparison using the NCAA numbers that are available I went back and looked up all the bowl numbers for the top five teams in each category for every available season, recalculated the average and came up with the season leader in these two categories. The charts and graphs that follow are the result.
 |
|
 |
The numbers available over at College Football Data Warehouse indicate that in 1987 Oklahoma allowed only 8.5 points per game and in 1988 Auburn permitted just 7.67 points per game. The folks over at War Eagle Reader have a very well done breakdown on these two teams in comparison with the 2011 Crimson Tide defense.
|
Loading comments...