One of the many areas in which football stats differ from those of other sports is with the nature of the offensive line. We can figure out ways to evaluate individuals at the skill positions, and potentially even at a few positions on defense, but without knowing the playcall and knowing the role of every lineman, how can one possibly hope to evaluate an offensive line as a whole? Even full game-charting data would only get us a small portion of the way there.
So we do what we can. There are two primary measures we use for evaluating offensive line play. Obviously there are no individual evaluations here -- the only thing we have that includes a single lineman's name is when they commit a penalty -- but with the following two measures (which you've already seen used quite a bit in the Summer Vacation series), we can at least get a general idea for how well an offensive line performed as compared to other units on offense.
Adj. Line Yards
From the NFL definition of Adjusted Line yards at the Football Outsiders glossary:
Adjusted Line Yards (ALY): Statistic which attempts to, even to a small extent, separate the ability of a running back from the ability of the offensive line. Adjusted Line Yards begin as a measure of average rushing yards per play by running backs only, adjusted in the following way:
- 0-4 yards: 100% strength
- 5-10 yards: 50% strength
- 11+ yards: not included
- runs for a loss: 120% strength
How did Aaron and company come up with those numbers? From an expanded explanation:
We have enough data amassed that we can try to separate the effect that the running back has on a particular play from the effect of the offensive line (and other offensive blockers) and the effect of the defense. A team might have two running backs in its stable: RB A, who averages 3.0 yards per carry, and RB B, who averages 3.5 yards per carry. Who is the better back? Imagine that RB A doesn't just average 3.0 yards per carry, but gets exactly 3 yards on every single carry, while RB B has a highly variable yardage output: sometimes 5 yards, sometimes -2 yards, sometimes 20 yards. The difference in variability between the runners can be exploited to not only determine the difference between the runners, but the effect the offensive line has on every running play.
We know that at some point in every long running play, the running back has gotten past all of his offensive line blocks. From here on, the rest of the play is dependent on the runner's own speed and elusiveness, combined with the speed and tackling ability of the defensive players. If Tiki Barber breaks through the line for 50 yards, avoiding tacklers all the way to the goal line, his offensive line has done a great job -- but they aren't responsible for most of that run. How much are they responsible for?
For each running back carry, we calculated the probability that the back involved would run for the specific yardage on that play, based on that back's average yardage per carry and the variability of their yardage on every play. We also calculated the probability that the offense would get the yardage based on the team's rushing average and variability without the back involved in the play, and the probability that the defense would give up the specific amount of yardage based on its average rushing yards allowed per carry and variability. For example, based on his rushing average and variability, the probability in 2004 that Tiki Barber would have a positive carry was 80% while the probability that Giants would have a positive carry without Barber running was only 73%.
Yardage ends up falling into roughly the following combinations: Losses, 0-4 yards, 5-10 yards, and 11+ yards. In general, the offensive line is 20% more responsible for lost yardage than it is for yardage gained up to four yards, but 50% less responsible for yardage gained from 5-10 yards, and not responsible for yardage past that. Thus, the creation of Adjusted Line Yards.
...
The system is far from perfect. We don't know when a guard is pulling and when a guard is blocking straight ahead. We know that some runners are just inherently better going up the middle, and some are better going side to side, and we can't measure how much that impacts these numbers. We have no way of knowing the blocking contribution made by fullbacks, tight ends, or wide receivers.
There is a decent possibility that the parameters for line yards could be a little different at the collegiate level -- just like the parameters for success rates are different; one day I'll get to that piece of the to-do list. For now, we simply use the NFL definition. Even if there are differences, they will almost certainly not be significant enough to render the current measure worthless.
The Adj. Line Yards figure you see both after the jump and in the Summer Vacation profiles basically combines a team's Line Yards per carry with an adjustment for the quality of opponent. I am sharing both the raw and adjusted figures below.
Adj. Sack Rates
This one is a little easier to figure out. Sack Rate is simply (Sacks) / (Sacks + Passes). It tells you how frequently a passer was sacked per pass attempt. The "adjusted" portion of Adj. Sack Rates has the same sentiment as the adjustment for line yards -- it looks at who the pass attempts came against and how many sacks would have been expected against said opponents. Again, below you'll see both raw and adjusted sack figures.
For purposes of team profiles, I like to look a lot at standard downs and passing downs sack rates. It is part of the equation for the "Need for Blitzes" portion of the Defensive Footprint. But for the rates below, it simply looks at all pass attempts -- standard down or passing down -- that took place while a game was "close."
Data
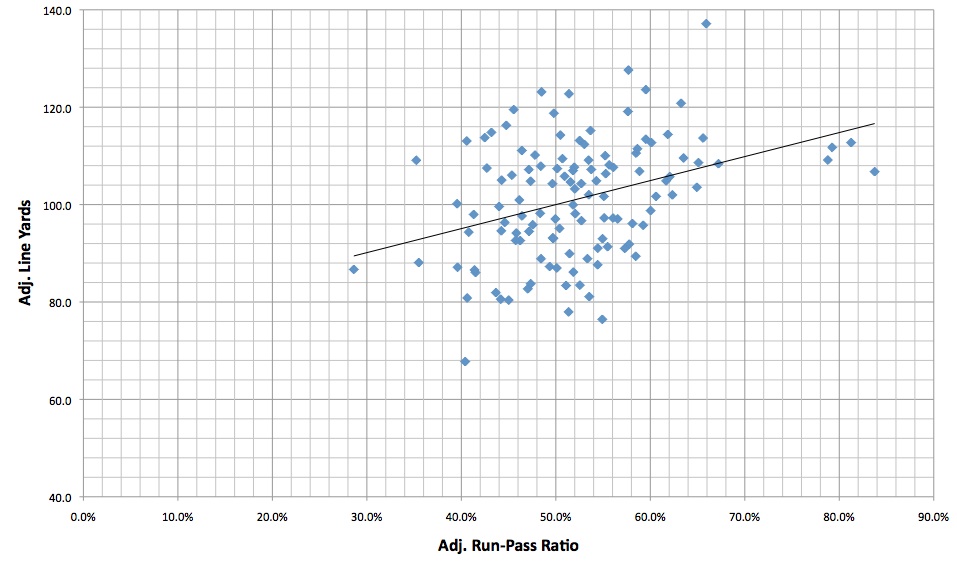
For perspective, I am listing the below teams according to their Adj. Run-Pass Ratio. As you'll see, there is a bit of a correlation between Run-Pass Ratio and Adj. Line Yards. To find your team the fastest, I would recommend simply doing a Ctrl-F search.
Quick note: like all the other opponent-adjusted stats I work with, Adj. Line Yards and Adj. Sack Rate are calibrated so that 100.0 = perfectly average. Above 100 is good, below 100 is bad. You'll notice that the extremes on both ends of the Adj. Sack Rate scale are much further from average than on the Adj. Line Yards scale. Among other things, that is because teams allow between about 10 and 40 sacks in a given year, but even the least-frequent rushing team rushes hundreds of times. The scale is a bit more sensitive on the sack rates side of the equation, then.
| Offense | Adj. Run-Pass | Rk | Sack Rate | Rk | Adj. Sack Rate | Rk | LY/Carry | Rk | Adj. LY | Rk |
| Army | 83.7% | 1 | 5.8% | 58 | 85.4 | 78 | 3.24 | 20 | 106.8 | 46 |
| Air Force | 81.3% | 2 | 2.5% | 10 | 211.0 | 12 | 3.52 | 7 | 112.7 | 20 |
| Georgia Tech | 79.2% | 3 | 8.0% | 101 | 77.8 | 95 | 3.28 | 15 | 111.8 | 23 |
| Navy | 78.8% | 4 | 6.7% | 76 | 75.6 | 96 | 3.43 | 11 | 109.2 | 31 |
| Nebraska | 67.2% | 5 | 9.9% | 117 | 60.4 | 113 | 3.22 | 22 | 108.4 | 35 |
| Auburn | 65.9% | 6 | 6.6% | 74 | 106.9 | 51 | 3.56 | 3 | 137.1 | 1 |
| Illinois | 65.6% | 7 | 7.5% | 88 | 68.9 | 107 | 3.27 | 16 | 113.7 | 16 |
| Mississippi State | 65.1% | 8 | 7.8% | 97 | 82.5 | 89 | 3.06 | 43 | 108.6 | 34 |
| Central Florida | 64.9% | 9 | 5.8% | 59 | 96.8 | 61 | 3.07 | 40 | 103.6 | 58 |
| Northern Illinois | 63.5% | 10 | 3.4% | 20 | 160.1 | 23 | 3.24 | 19 | 109.6 | 29 |
| Wisconsin | 63.3% | 11 | 5.3% | 49 | 89.5 | 70 | 3.53 | 6 | 120.8 | 6 |
| Eastern Michigan | 62.3% | 12 | 6.6% | 71 | 92.6 | 67 | 2.91 | 72 | 102.0 | 61 |
| Ohio | 62.1% | 13 | 6.1% | 61 | 87.7 | 72 | 3.01 | 50 | 105.8 | 50 |
| TCU | 61.9% | 14 | 2.9% | 15 | 186.0 | 16 | 3.54 | 4 | 114.4 | 13 |
| Oregon | 61.7% | 15 | 2.6% | 12 | 246.4 | 6 | 3.18 | 26 | 104.9 | 53 |
| Kansas State | 60.6% | 16 | 10.1% | 118 | 57.2 | 116 | 3.08 | 37 | 101.7 | 62 |
| LSU | 60.1% | 17 | 6.9% | 80 | 95.8 | 62 | 2.95 | 61 | 112.7 | 21 |
| Western Kentucky | 60.0% | 18 | 8.9% | 109 | 69.5 | 105 | 3.05 | 44 | 98.8 | 68 |
| Nevada | 59.5% | 19 | 2.7% | 14 | 227.7 | 9 | 3.63 | 1 | 123.6 | 3 |
| Virginia Tech | 59.5% | 20 | 9.0% | 111 | 74.6 | 98 | 3.17 | 29 | 113.4 | 17 |
| Offense | Adj. Run-Pass | Rk | Sack Rt | Rk | Adj. Sack Rt | Rk | LY/Carry | Rk | Adj. LY | Rk |
| Ole Miss | 59.2% | 21 | 4.2% | 34 | 152.6 | 28 | 2.76 | 84 | 95.8 | 81 |
| UCLA | 58.9% | 22 | 7.6% | 91 | 84.3 | 81 | 3.14 | 32 | 106.8 | 45 |
| Connecticut | 58.6% | 23 | 3.7% | 25 | 169.2 | 19 | 2.98 | 56 | 111.5 | 24 |
| South Florida | 58.5% | 24 | 7.2% | 86 | 94.3 | 63 | 2.92 | 70 | 110.6 | 26 |
| Utah State | 58.5% | 25 | 8.0% | 100 | 75.4 | 97 | 2.57 | 103 | 89.4 | 97 |
| North Texas | 58.1% | 26 | 7.9% | 98 | 70.2 | 104 | 2.97 | 59 | 96.1 | 79 |
| Wake Forest | 57.8% | 27 | 6.1% | 63 | 84.3 | 82 | 2.65 | 94 | 91.9 | 92 |
| Michigan | 57.7% | 28 | 2.2% | 6 | 228.8 | 8 | 3.51 | 8 | 127.6 | 2 |
| Ohio State | 57.6% | 29 | 5.3% | 50 | 104.6 | 54 | 3.25 | 18 | 119.1 | 8 |
| Ball State | 57.3% | 30 | 5.0% | 45 | 111.2 | 48 | 2.67 | 93 | 91.0 | 95 |
| West Virginia | 56.5% | 31 | 6.6% | 72 | 97.0 | 60 | 2.79 | 82 | 97.1 | 75 |
| Stanford | 56.1% | 32 | 1.6% | 1 | 386.8 | 1 | 3.17 | 28 | 107.7 | 39 |
| Boston College | 56.1% | 33 | 7.8% | 94 | 83.3 | 87 | 2.64 | 96 | 97.2 | 74 |
| Temple | 55.7% | 34 | 7.8% | 96 | 73.7 | 100 | 3.05 | 46 | 108.1 | 36 |
| Middle Tennessee | 55.5% | 35 | 4.4% | 37 | 119.2 | 41 | 2.84 | 75 | 91.4 | 93 |
| Louisville | 55.3% | 36 | 4.6% | 42 | 134.1 | 34 | 2.92 | 67 | 106.3 | 47 |
| South Carolina | 55.2% | 37 | 6.3% | 67 | 100.7 | 55 | 2.95 | 63 | 110.0 | 28 |
| Toledo | 55.1% | 38 | 5.2% | 48 | 127.8 | 36 | 2.69 | 90 | 97.3 | 73 |
| Florida International | 55.1% | 39 | 4.5% | 39 | 125.6 | 37 | 2.97 | 58 | 101.7 | 63 |
| Fresno State | 54.9% | 40 | 9.7% | 114 | 61.4 | 112 | 2.65 | 95 | 93.0 | 89 |
| Offense | Adj. Run-Pass | Rk | Sack Rt | Rk | Adj. Sack Rt | Rk | LY/Carry | Rk | Adj. LY | Rk |
| Wyoming | 54.9% | 41 | 9.3% | 112 | 63.5 | 111 | 2.13 | 119 | 76.4 | 119 |
| Purdue | 54.4% | 42 | 4.3% | 36 | 110.0 | 50 | 2.74 | 88 | 91.1 | 94 |
| Rice | 54.4% | 43 | 6.2% | 65 | 86.1 | 76 | 2.82 | 81 | 87.6 | 101 |
| Florida | 54.3% | 44 | 5.4% | 51 | 120.1 | 40 | 2.77 | 83 | 104.9 | 52 |
| California | 53.8% | 45 | 7.1% | 83 | 91.3 | 69 | 3.16 | 30 | 107.2 | 42 |
| Georgia | 53.7% | 46 | 7.1% | 84 | 86.9 | 74 | 3.19 | 24 | 115.2 | 11 |
| New Mexico State | 53.5% | 47 | 4.1% | 31 | 129.1 | 35 | 2.60 | 99 | 81.1 | 114 |
| Kansas | 53.5% | 48 | 9.6% | 113 | 47.5 | 119 | 3.08 | 39 | 102.0 | 60 |
| Northwestern | 53.5% | 49 | 9.7% | 115 | 48.0 | 118 | 3.06 | 42 | 109.1 | 32 |
| UNLV | 53.3% | 50 | 7.0% | 81 | 83.4 | 85 | 2.50 | 109 | 88.9 | 98 |
| Miami-FL | 53.0% | 51 | 3.6% | 23 | 173.8 | 18 | 3.19 | 23 | 112.4 | 22 |
| Clemson | 52.7% | 52 | 3.5% | 21 | 188.5 | 14 | 2.59 | 100 | 96.7 | 77 |
| Minnesota | 52.7% | 53 | 3.2% | 17 | 157.4 | 26 | 2.89 | 74 | 104.3 | 56 |
| New Mexico | 52.5% | 54 | 8.4% | 102 | 55.5 | 117 | 2.53 | 106 | 83.5 | 110 |
| Florida State | 52.5% | 55 | 6.8% | 79 | 94.0 | 65 | 2.82 | 79 | 113.2 | 18 |
| Southern Miss | 52.1% | 56 | 3.6% | 24 | 158.4 | 24 | 3.10 | 36 | 98.1 | 70 |
| Iowa | 52.0% | 57 | 5.5% | 52 | 84.0 | 83 | 3.00 | 54 | 103.2 | 59 |
| Michigan State | 52.0% | 58 | 5.7% | 56 | 86.5 | 75 | 3.03 | 47 | 107.7 | 38 |
| Rutgers | 51.9% | 59 | 14.6% | 120 | 46.8 | 120 | 2.45 | 112 | 86.1 | 107 |
| Iowa State | 51.8% | 60 | 7.8% | 93 | 78.0 | 94 | 2.83 | 78 | 99.9 | 66 |
| Offense | Adj. Run-Pass | Rk | Sack Rt | Rk | Adj. Sack Rt | Rk | LY/Carry | Rk | Adj. LY | Rk |
| Boise State | 51.8% | 61 | 1.9% | 4 | 316.1 | 3 | 3.23 | 21 | 107.0 | 44 |
| BYU | 51.6% | 62 | 4.0% | 30 | 140.8 | 30 | 3.29 | 13 | 104.6 | 55 |
| Colorado | 51.5% | 63 | 4.7% | 43 | 116.4 | 43 | 2.74 | 87 | 89.9 | 96 |
| Pittsburgh | 51.4% | 64 | 6.1% | 64 | 106.2 | 52 | 3.19 | 25 | 122.7 | 5 |
| Florida Atlantic | 51.4% | 65 | 8.6% | 106 | 71.6 | 103 | 2.32 | 118 | 78.0 | 118 |
| UL-Monroe | 51.1% | 66 | 7.9% | 99 | 74.0 | 99 | 2.57 | 102 | 83.4 | 111 |
| Washington | 50.9% | 67 | 5.5% | 53 | 115.5 | 44 | 3.11 | 35 | 105.8 | 49 |
| Penn State | 50.7% | 68 | 2.4% | 8 | 193.9 | 13 | 2.83 | 77 | 109.4 | 30 |
| Syracuse | 50.5% | 69 | 8.5% | 105 | 69.2 | 106 | 3.15 | 31 | 114.3 | 14 |
| Vanderbilt | 50.4% | 70 | 8.9% | 108 | 65.9 | 110 | 2.68 | 92 | 95.1 | 82 |
| Tulsa | 50.1% | 71 | 5.8% | 57 | 83.8 | 84 | 3.51 | 9 | 107.4 | 41 |
| Buffalo | 50.1% | 72 | 5.6% | 54 | 92.5 | 68 | 2.69 | 91 | 87.0 | 104 |
| Utah | 50.0% | 73 | 2.5% | 11 | 237.7 | 7 | 2.94 | 65 | 97.1 | 76 |
| Alabama | 49.8% | 74 | 8.7% | 107 | 78.7 | 93 | 3.35 | 12 | 118.8 | 9 |
| Akron | 49.7% | 75 | 7.8% | 95 | 73.0 | 102 | 2.52 | 107 | 93.0 | 88 |
| Maryland | 49.7% | 76 | 5.6% | 55 | 120.5 | 39 | 2.61 | 97 | 93.2 | 87 |
| Louisiana Tech | 49.6% | 77 | 4.2% | 33 | 136.1 | 33 | 2.98 | 57 | 104.3 | 57 |
| Memphis | 49.4% | 78 | 8.4% | 102 | 67.4 | 109 | 2.58 | 101 | 87.3 | 102 |
| USC | 48.5% | 79 | 3.9% | 27 | 160.8 | 22 | 3.54 | 5 | 123.1 | 4 |
| San Diego State | 48.4% | 80 | 1.8% | 2 | 276.1 | 4 | 2.94 | 64 | 88.9 | 99 |
| Offense | Adj. Run-Pass | Rk | Sack Rt | Rk | Adj. Sack Rt | Rk | LY/Carry | Rk | Adj. LY | Rk |
| Baylor | 48.4% | 81 | 4.5% | 38 | 111.8 | 47 | 3.01 | 49 | 107.9 | 37 |
| UTEP | 48.3% | 82 | 4.6% | 41 | 113.6 | 46 | 3.14 | 33 | 98.2 | 69 |
| Oregon State | 47.8% | 83 | 8.5% | 104 | 87.6 | 73 | 3.00 | 55 | 110.2 | 27 |
| Texas | 47.6% | 84 | 4.3% | 35 | 116.8 | 42 | 2.95 | 62 | 95.8 | 80 |
| Kent State | 47.3% | 85 | 4.6% | 40 | 114.7 | 45 | 2.44 | 113 | 83.7 | 109 |
| Texas A&M | 47.3% | 86 | 6.8% | 78 | 93.7 | 66 | 3.07 | 41 | 104.8 | 54 |
| North Carolina | 47.2% | 87 | 7.8% | 92 | 82.7 | 88 | 2.74 | 86 | 94.5 | 84 |
| Kentucky | 47.1% | 88 | 4.0% | 28 | 161.2 | 21 | 2.92 | 71 | 107.2 | 43 |
| Washington State | 47.0% | 89 | 11.2% | 119 | 60.0 | 114 | 2.48 | 111 | 82.7 | 112 |
| Arkansas State | 46.4% | 90 | 5.1% | 46 | 111.2 | 49 | 3.01 | 51 | 97.7 | 72 |
| Virginia | 46.4% | 91 | 3.7% | 26 | 137.4 | 32 | 3.29 | 14 | 111.1 | 25 |
| Tennessee | 46.2% | 92 | 9.0% | 110 | 68.7 | 108 | 2.56 | 104 | 92.6 | 91 |
| UAB | 46.1% | 93 | 2.7% | 13 | 187.4 | 15 | 2.92 | 68 | 100.9 | 64 |
| Tulane | 45.8% | 94 | 7.2% | 87 | 73.4 | 101 | 2.82 | 80 | 94.2 | 86 |
| Oklahoma | 45.8% | 95 | 3.5% | 22 | 158.3 | 25 | 2.60 | 98 | 92.6 | 90 |
| Arkansas | 45.5% | 96 | 6.1% | 62 | 100.2 | 57 | 3.13 | 34 | 119.5 | 7 |
| Missouri | 45.3% | 97 | 3.3% | 19 | 156.3 | 27 | 3.02 | 48 | 106.0 | 48 |
| UL-Lafayette | 45.0% | 98 | 7.1% | 85 | 85.8 | 77 | 2.38 | 116 | 80.4 | 117 |
| Oklahoma State | 44.8% | 99 | 1.8% | 3 | 322.1 | 2 | 3.44 | 10 | 116.3 | 10 |
| Colorado State | 44.6% | 100 | 9.8% | 116 | 57.8 | 115 | 2.75 | 85 | 96.3 | 78 |
| Offense | Adj. Run-Pass | Rk | Sack Rt | Rk | Adj. Sack Rt | Rk | LY/Carry | Rk | Adj. LY | Rk |
| Houston | 44.3% | 101 | 2.4% | 9 | 220.7 | 10 | 3.26 | 17 | 105.0 | 51 |
| Troy | 44.2% | 102 | 4.0% | 28 | 138.4 | 31 | 2.93 | 66 | 94.6 | 83 |
| Marshall | 44.2% | 103 | 3.0% | 16 | 180.9 | 17 | 2.42 | 115 | 80.6 | 116 |
| Arizona State | 44.0% | 104 | 6.6% | 72 | 97.7 | 59 | 3.01 | 53 | 99.6 | 67 |
| Miami-OH | 43.7% | 105 | 6.6% | 70 | 85.2 | 79 | 2.35 | 117 | 81.9 | 113 |
| Cincinnati | 43.2% | 106 | 7.0% | 82 | 100.4 | 56 | 3.18 | 27 | 114.8 | 12 |
| Notre Dame | 42.7% | 107 | 4.1% | 32 | 148.6 | 29 | 2.90 | 73 | 107.5 | 40 |
| NC State | 42.5% | 108 | 6.7% | 75 | 88.4 | 71 | 3.08 | 38 | 113.7 | 15 |
| Duke | 41.5% | 109 | 5.2% | 47 | 106.1 | 53 | 2.49 | 110 | 86.0 | 108 |
| San Jose State | 41.4% | 110 | 6.4% | 68 | 84.8 | 80 | 2.44 | 114 | 86.6 | 106 |
| Arizona | 41.3% | 111 | 6.3% | 66 | 99.6 | 58 | 2.97 | 60 | 98.0 | 71 |
| Western Michigan | 40.8% | 112 | 5.8% | 59 | 94.3 | 64 | 2.92 | 68 | 94.3 | 85 |
| Central Michigan | 40.6% | 113 | 6.7% | 76 | 80.4 | 91 | 2.50 | 108 | 80.8 | 115 |
| SMU | 40.6% | 114 | 6.5% | 69 | 83.4 | 86 | 3.61 | 2 | 113.1 | 19 |
| Bowling Green | 40.4% | 115 | 7.5% | 89 | 81.0 | 90 | 1.81 | 120 | 67.8 | 120 |
| Indiana | 39.6% | 116 | 2.1% | 5 | 220.2 | 11 | 2.53 | 105 | 87.1 | 103 |
| Texas Tech | 39.6% | 117 | 3.2% | 18 | 165.5 | 20 | 3.01 | 52 | 100.2 | 65 |
| Idaho | 35.5% | 118 | 7.5% | 90 | 79.4 | 92 | 2.83 | 76 | 88.1 | 100 |
| East Carolina | 35.2% | 119 | 2.3% | 7 | 261.8 | 5 | 3.05 | 45 | 109.1 | 33 |
| Hawaii | 28.6% | 120 | 4.8% | 44 | 122.7 | 38 | 2.73 | 89 | 86.7 | 105 |
Cam Newton was incredible in 2010, but he had quite possibly the best run blocking in the country doing him some favors as well (it is always a possibility, of course, that he was doing them some favors along the way too, and that rubbed off on their line numbers). That's how Newton's Adj. POE was not the highest among QBs.
How does Hawaii's Alex Green end up atop the Adj. POE rankings for 2010? Well, running when everybody expected a pass certainly helped ... but what perhaps made an even larger difference is the fact that his line did him very few favors. What Adj. POE sees is that most of the yards he generated, he generated on his own.
If you look closely enough, you can see Hawaii wasn't alone in the "don't run much, don't block the run well" crowd. While there is no correlation whatsoever between run-pass ratios and sack rates (which somewhat makes sense, since being pass-heavy could mean quick hitch after quick hitch and low sack rates, or it could mean old school, downfield passing and high sack rates), there is a reasonably strong one between run-pass ratios and line yards. A 0.33 correlation, to be exact. Not huge, but solid.
So sack rates depend on scheme and intent (and a passer's own ability to avoid the rush). Line yards depend, at least partially, on practice and repetition.
I cannot emphasize enough that these measures are incredibly imperfect, even more flawed than other advanced stats. This is a given. There's only so much we can glean from a line of play-by-play. Hell, for that matter, there's only so much we could do if we had perfect, complete charting data.
But this is a start. You can learn more about a line with these stats than without them, which means they're worth something, even if we shouldn't overreact to the numbers' conclusions.
Loading comments...